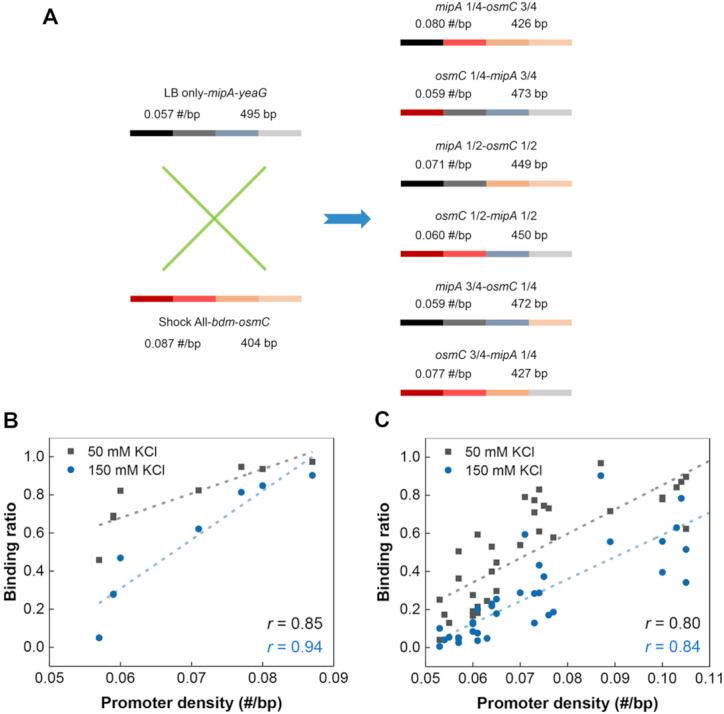
Figure 6.

Positive correlation between RNAP binding and the density of promoter-like sites. (A) An overview of the DNA components of six chimeras derived from mipA-yeaG and bdm-osmC. The numbers above the bar indicate the corresponding density of promoter-like sites and length of DNA. Plots of binding ratio with RNAP measured by EMSA against promoter density based on mipA-yeaG, bdm-osmC and six chimeras (B) or the natural intergenic regions (C). Each filled square or circle denotes the data collected from a chimera or natural intergenic region. The linear regression lines are drawn across the plots (dashed line). The Pearson's correlation coefficient (r) is indicated.
