Figure 6.
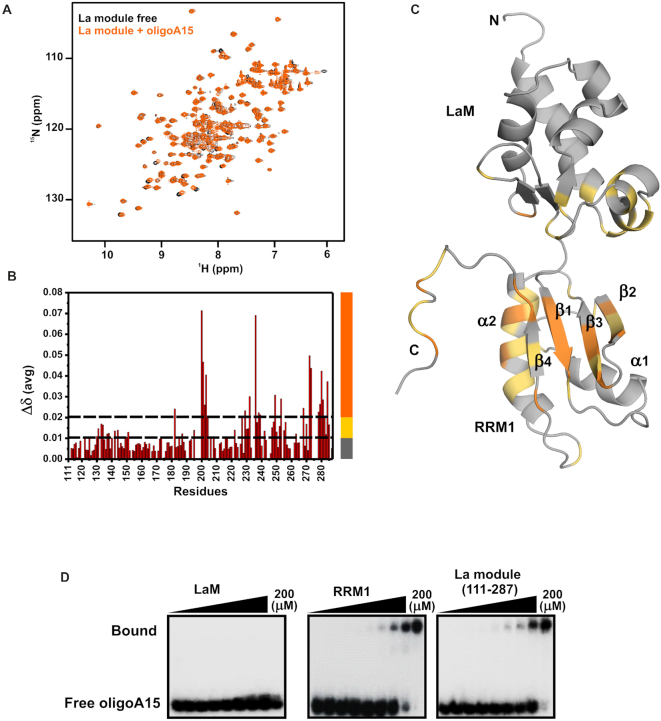
Analysis of the interaction between LARP4A and oligoA15 RNA. (A–C) NMR titration of the LARP4A La module with oligoA15. Panel (A) displays the overlay of the 1H-15N HSQC spectra of the La module in the apo and holo form (black and orange, respectively). Panel (B) shows protein chemical shift perturbations (Δδavg) upon oligoA15 binding and (C) is the mapping of the Δδavg on a representative structure of the La module in cartoon mode representation. Two thresholds (represented with dotted lines in panel B) were considered in the analysis and colour coded on the structure (panel C) as follows: 0.01 < Δδavg ≤ 0.02 ppm in yellow and Δδavg > 0.02 in orange. Unaffected residues are depicted in grey. The secondary structure elements and the N- and C-termini are labelled on the structures. (D) The affinity of LARP4A LaM (left) and RRM1 (centre) and La module (right) for oligoA15 was assessed by EMSA. Protein concentrations of 0, 1.6, 3.1, 6.3, 12.5, 25, 50, 100 and 200 μM were used in the experiments. The RRM1 binds oligoA RNA with a similar affinity as the La module, indicating little (if any) involvement of LaM to binding.

