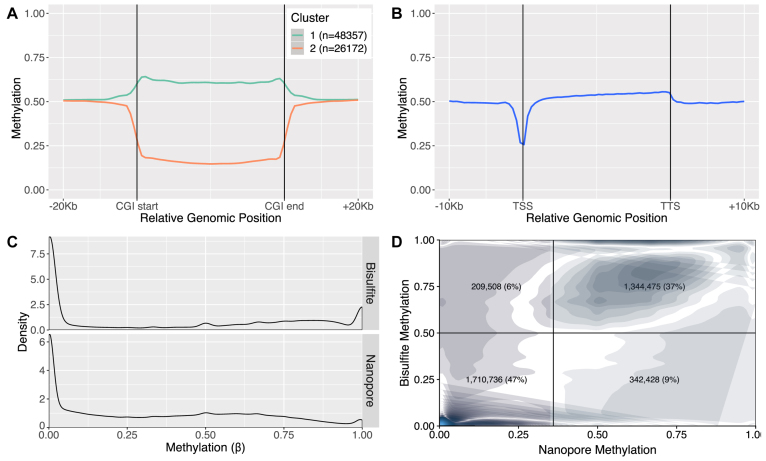
Figure 1.
Nanopore methylation calls are consistent with expected results and established technologies. (A) Metaplot of nanopore methylation calls across CGIs, clustered in two groups of high and low methylation. (B) Metaplot of nanopore methylation calls across the aggregated gene bodies of all protein-coding genes recapitulated known methylation structures. (C) Density of methylation calls (β, the average methylation based on all reads covering that position) for sites covered by both nanopore and RRBS. (D) Joint density of nanopore and RRBS methylation calls for the same sites as in panel (C). Darker regions indicate regions of higher density, while lighter regions indicate regions of lower density. The density plot is split into four quadrants according to a RRBS threshold of 0.5 and a nanopore threshold of 0.36, and the percentage of sites in each quadrant is displayed.

