Figure 3.

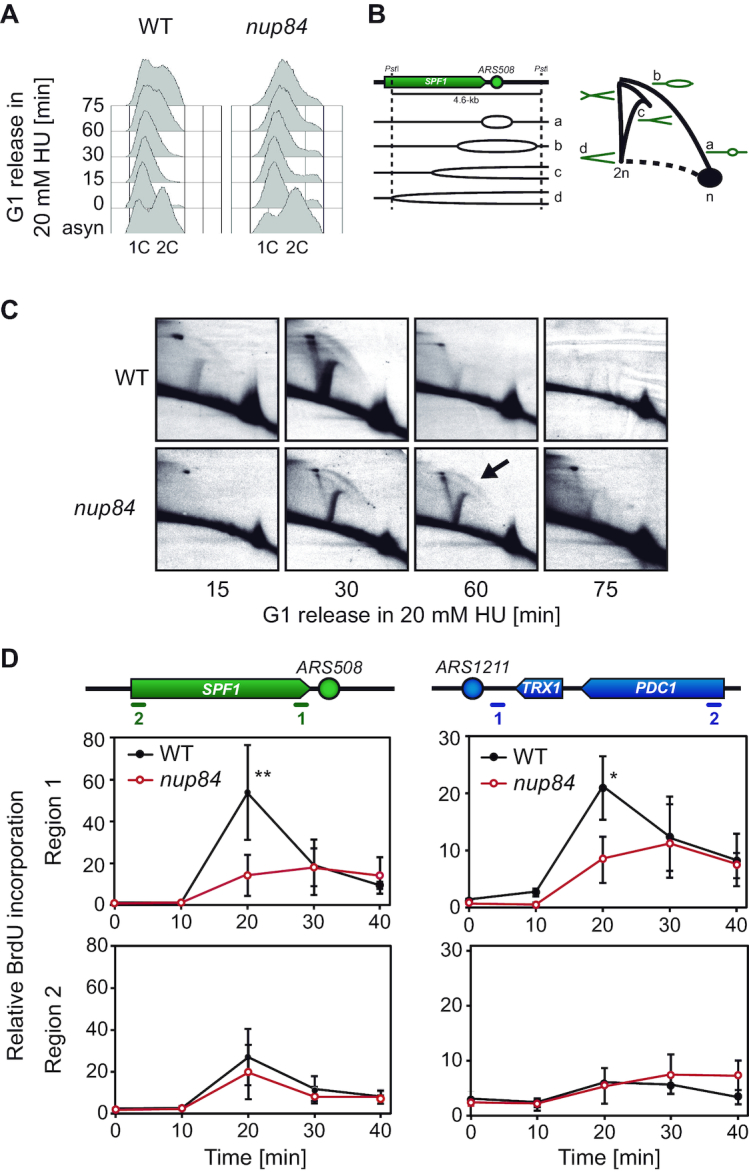
Replication impairment in nup84Δ cells. (A) Flow cytometry analyses of wild type (WT, WRB1-1A) and nup84Δ (WRN84B1-10C) cells released from α-factor-induced G1 arrest into HU-containing medium (20 mM). (B) Diagram depicting the appearance of different replication intermediates at the analysed ARS508-containing fragment and their migration in 2D-gel electrophoresis analyses. (C) Analysis of replication intermediates at the early origin ARS508 by 2D-gel electrophoresis in WT (WRB1-1A) and nup84Δ (WRN84B1-10C) cells released from α-factor-induced G1 arrest into HU-containing medium (20 mM). Replication intermediates were analysed at different time points after G1 release. (D) BrdU incorporation in WT (SYRB1-4C) and nup84Δ (SYRN84B1-10C) strains. Cells were synchronized in G1 with α-factor and released into fresh medium. BrdU immunoprecipitation was performed at different time points after G1 release, and the resulting DNA analysed by real time qPCR at the early replication origins ARS508 and ARS1211. Quantification of BrdU incorporation relative to input DNA and to time 0 (no BrdU) is plotted for each region. Average and standard deviation are shown (N = 3). *P < 0.05; **P < 0.01 (unpaired Student's t-test). Schemes of the analysed region are shown on top of the graphs.
