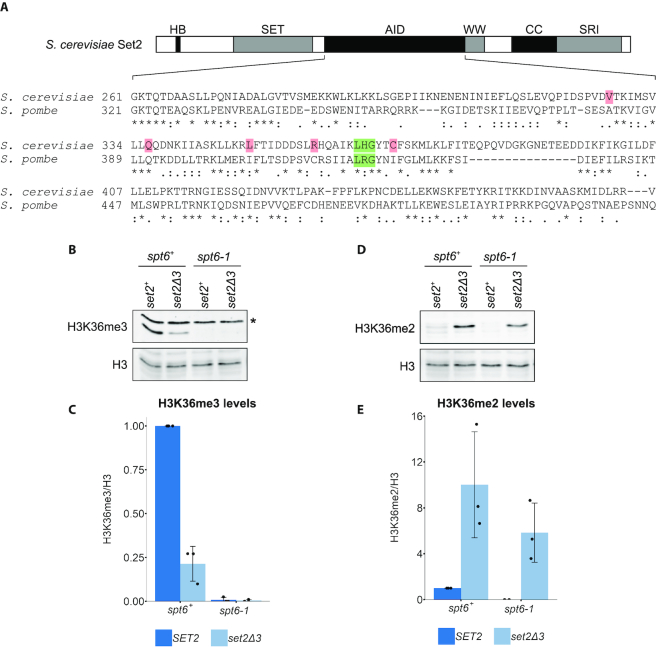
Figure 8.
The genetic interaction between Spt6 and Set2 is conserved in Schizosaccharomyces pombe. (A) Conservation of the amino acid sequence of the central region of Set2 between Saccharomyces cerevisiae (amino acids 261–475) and S. pombe. The residues highlighted in green correspond to the three amino acids deleted in the SET2Δ3 mutation. The residues highlighted in pink denote the location of the other SET2sup mutations. An asterisk indicates an identical residue, a colon indicates a highly similar amino acid (scoring > 0.5 in the Gonnet PAM 250 matrix) and a period indicates a weakly similar amino acid (scoring ≤ 0.5 in the Gonnet PAM 250 matrix). (B) Western blot assaying the effect of the set2Δ3 mutation on H3K36me3 levels in spt6-1 cells in S. pombe. Histone H3 was used as a loading control. Asterisk denotes a non-specific band. (C) Quantification of western blots assaying H3K36me3 levels in the indicated strains. (D) Western blot assaying the effect of the set2Δ3 mutation on H3K36me2 levels in spt6-1 cells in S. pombe. Histone H3 was used as a loading control. (E) Quantification of western blots assaying H3K36me2 levels in the indicated strains. In both graphs, the black dots represent the individual data points for three experiments and the bars show the mean ± standard deviation.

