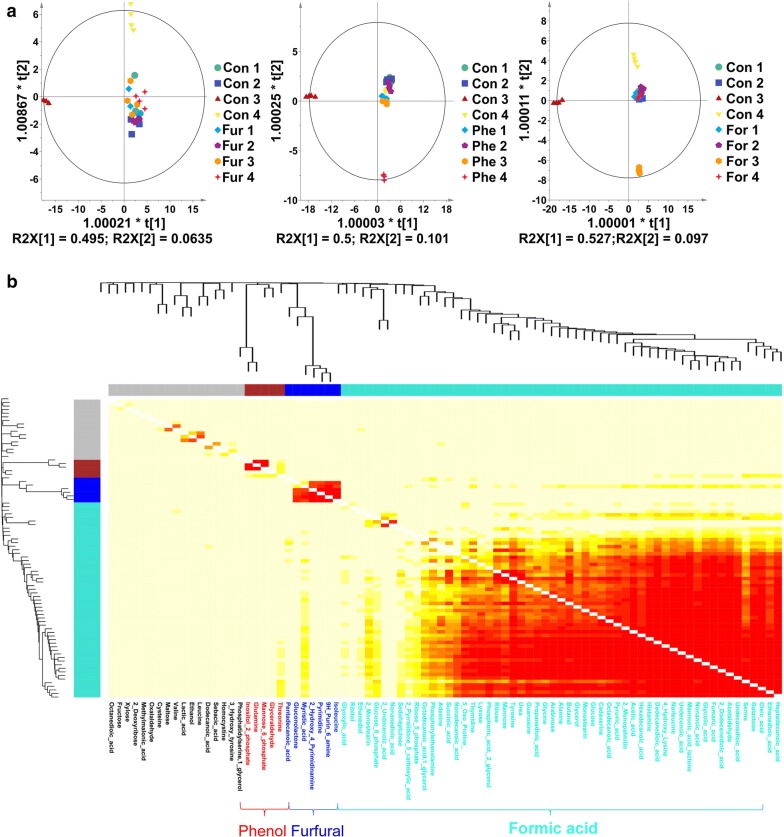
Fig. 3.
PLS-DA modeling (a) and WGCNA analysis (b) of the intracellular metabolome under the stress of furfural, phenol and formic acid, respectively. The cyan module corresponds to the formic acid condition, the blue module corresponds to furfural condition, and the red module corresponds to phenol condition

