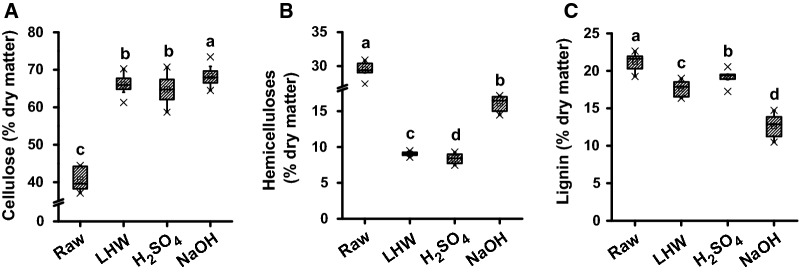
Fig. 5.
Alteration of cell wall composition after three optimal pretreatments in four typical pairs of Miscanthus accessions. A Cellulose level (% dry matter); B hemicelluloses and C lignin. Raw as raw materials without pretreatment. The line and square within the box presented the median and mean values of all data (n = 32); the bottom and top edges of the box indicated 25% and 75% of all data; the top and bottom bars (×) presented maximum and minimum values of all data, and the different letters (a, b, c, d) indicated that the mean values are significantly different from each other by LSD test (P < 0.05), respectively

