Fig. 1.
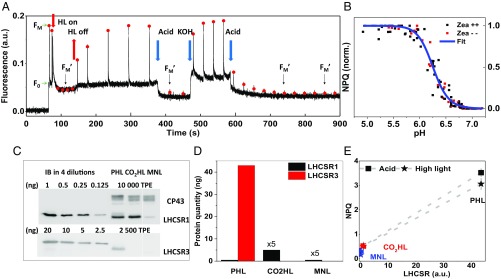
(A) A typical PAM Chl fluorometer trace of steady-state fluorescence in stt7-9. NPQ can be induced with high light (80 to 130 s), as well as by acetic acid (4.5 mM) (370 to 470 s). The quenching is fully reversible after KOH addition setting the pH back to 7 (470 to 500 s). FM and FM′ are indicated by red dots. Cells were grown photoautotrophically in high light. (B) pH titration curve of NPQ in cells obtained by sequentially adding ∼2 µL acetic acid (1 M stock) with nigericin (100 µM) to the same cell culture. NPQ levels were measured within ∼2 min after adding acetic acid; six and three biological replicas were measured for cells with and without zeaxanthin, respectively. For each replica, the NPQ values were normalized to 0 (NPQ_min) and 1 (NPQ_max). The fitted curve is a logistic function (y = 1/[1 + (x/x0)^p]), yielding x0 (the midpoint pH) of 6.25 ± 0.09. (C) Determination of the expression level of LHCSR1 and LHCSR3 in cells grown in high light photoautotrophically (PHL), photoautotrophically plus 5% CO2 (CO2HL), and in normal light mixotrophically (MNL) by immunoblots on the total protein extracts. For stoichiometry assessment, different amounts of inclusion bodies (IBs) of LHCSR1 and LHCSR3 were loaded on the gel. CP43 was used as a control. (D) The relative content of LHCSR1 and LHCSR3 proteins in 10 µg of TPE is shown. (E) Correlations between the total amount of LHCSR proteins (LHCSR1+LHCSR3) and the NPQ levels (connected by dashed lines) induced in the cells by high light and acetic acid. SDs of the NPQ values are included (n = 3).

