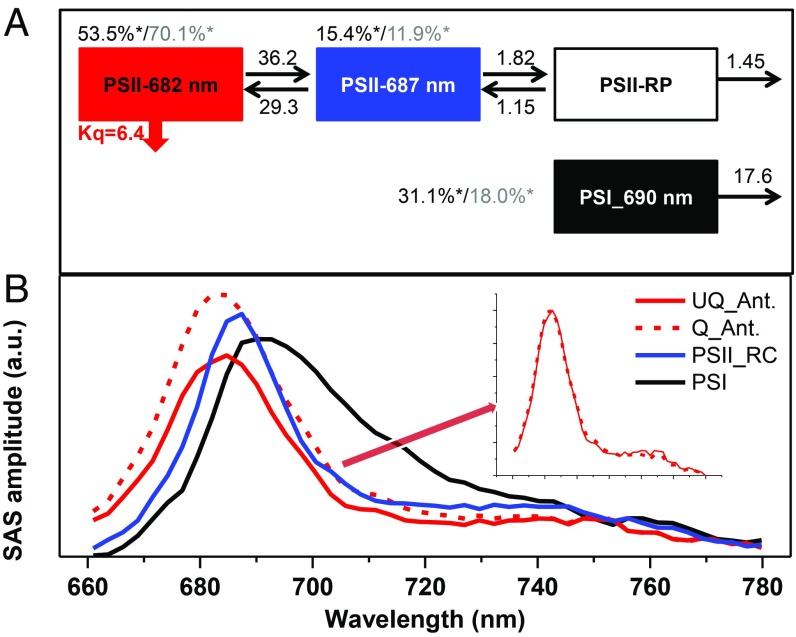
Fig. 3.
Target analysis results. (A) Schematic model used to describe the time-resolved fluorescence data; rates are given in ns−1, Kq is the rate of quenching, and asterisks indicate the initial excitations at 400 nm (black) and 475 nm (gray). (B) Species-associated spectra (SASs) of the compartments with the same colors as used in A. (B, Inset) Normalized spectra of the UQ_Ant. and Q_Ant. are shown.

