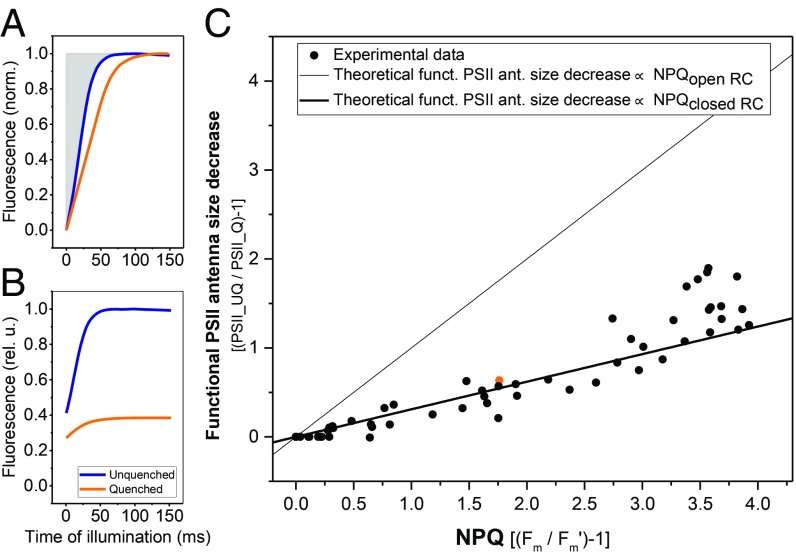
Fig. 4.
Functional antenna size of PSII decreases upon NPQ. (A) Typical fluorescence induction traces of cells in the unquenched (blue) and quenched state (orange; NPQ ∼ 1.8). Both curves are normalized to 1 at FM and to 0 at F0. (B) Same curves as shown in A but without normalization. (C) The relative increase in the area above the fluorescence induction curve in the presence of DCMU at increasing concentrations of acetic acid is plotted as a function of NPQ (see Methods for area calculation details). Solid lines depict theoretical scenarios where the functional antenna size decreases proportionally to the NPQ (thin line; NPQclosed RC = kNPQ/kclosed) and proportionally to the photochemical quenching + NPQ (thick line; NPQopen RC = kNPQ/kopen = NPQclosed RC × kclosed/kopen = NPQclosed RC × F0/FM, assuming kNPQ is the same for open and closed RCs); k represents the overall chlorophyll deexcitation rate of PSII supercomplexes. Each experiment is shown as a separate circle, and the specific data point that corresponds to A and B is highlighted in orange. The measurements were performed on four batches of high light-grown algae.

