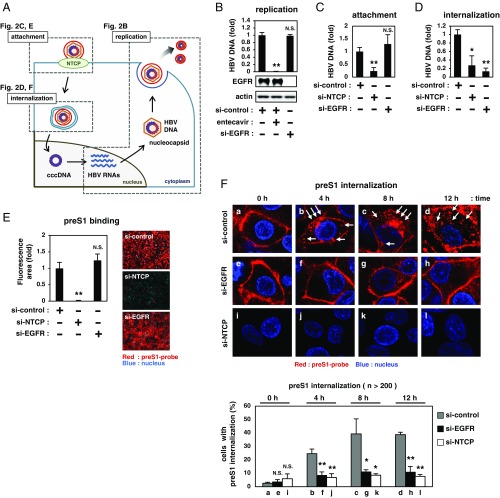
Fig. 2.
EGFR is involved in HBV internalization. (A) HBV life cycle. HBV attaches to the cell surface through NTCP (attachment), followed by internalization inside cells (internalization) and translocation into the nucleus to form cccDNA. cccDNA drives HBV replication by transcription of HBV RNAs, nucleocapsid formation, and secretion of HBV particles (replication). Evaluation of the activity of each step is shown in C and E (attachment), D and F (internalization), and B (replication). (B) HBV replication was evaluated by quantifying extracellular HBV DNA from HepG2.2.15.7 cells transfected with the indicated siRNA at 9 d posttransfection. Entecavir was used as a positive control to suppress HBV replication. (C) For evaluating viral attachment, HepG2-NTCP cells transfected with siRNAs (as indicated in Fig. 1 A, a) were exposed to HBV at 4 °C to allow viral attachment to the cell surface. After washing, cell-surface HBV DNA was quantified. (D) For quantifying the internalized HBV, HBV-attached cells (prepared as in C) were transferred to 37 °C to allow viral internalization into the cells and to quantify intracellular HBV DNA. (E) HepG2-NTCP cells transfected with siRNAs (as in Fig. 1 A, a) were exposed to preS1-probe (Right images). The fluorescence intensities are shown in the graph (Left). (F) siRNA-transfected HepG2-NTCP cells were attached to preS1-probe at 4 °C for 1 h, washed of free preS1-probe, and then transferred to 37 °C to allow incorporation of preS1-probe up to 12 h. Cells were observed using high-magnification confocal microscopy for preS1-probe internalization (red) after 0, 4, 8, and 12 h of incubation at 37 °C (Upper). White arrows show the internalized preS1 speckles (b–d). Percentages of cells exhibiting preS1 internalization are indicated in the graph (Lower) (see Materials and Methods).

