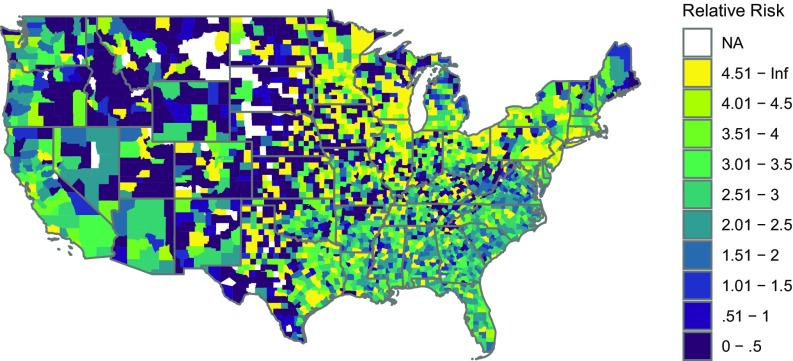
Fig. 1.
Relative risk ratio for out-of-school suspensions for each county in the continental United States. Relative risk ratio is computed as the percentage of black students suspended to the percentage of white students suspended, as reported in the 2015–2016 CRDC. Higher values indicate more black students suspended, relative to white students. Counties with the value NA either have no schools have zero black students enrolled or have zero white students enrolled. Interactive maps displaying the relative risk ratios and raw counts of black and white students who are enrolled and receive each type of disciplinary outcome by county can be found on T.R.’s website and at https://osf.io/pu79a/.

