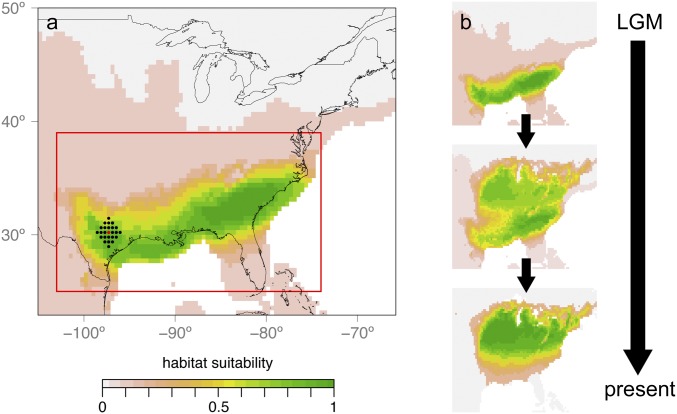
Fig. 1.
Schematic overview of demographic simulations. (A) Simulations were initiated in the LGM landscape (shown here for C. cordiformis) from a central deme (see red dot as an example) plus an area extending three additional demes (black dots) in all directions. Different geographic sources of expansion were modeled as selected from a uniform geographic prior (red rectangle). Per deme carrying capacities were scaled relative to maximum carrying capacity (Kmax) according to habitat suitability from an SDM. (B) Individuals were allowed to colonize the landscape with relative carrying capacities shifting from the LGM to present.

