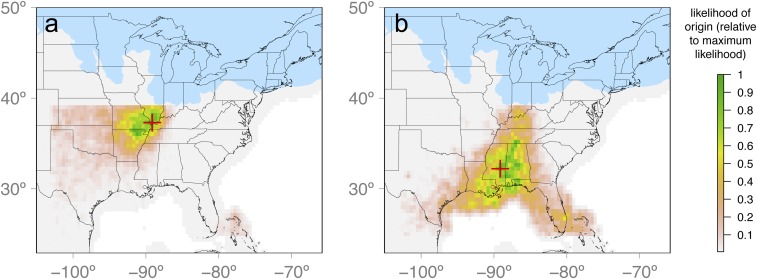
Fig. 2.
Estimated expansion origins (Ω; red cross) in C. cordiformis (A) and C. ovata (B). The shading of pixels depicts a probability surface (kernel density) showing the likelihood that each pixel served as the expansion origin relative to the pixel with the highest likelihood (i.e., Ω). Glaciated regions are shown in blue. The results presented in A and B are based on retention of four and three PC axes of variation in genetic summary statistics, respectively. Results based on retaining additional PC axes are presented in SI Appendix, Figs. S2 and S3.

