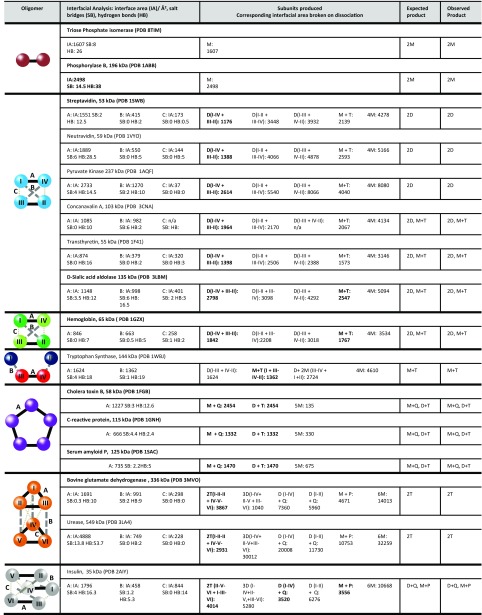
Fig. 1.
Interfacial information for the proteins studied, in addition to the predicted and observed SID products. Proteins highlighted in boldface type were used for the computational modeling. Only proteins for which a crystal or NMR structure for the complex exists (as opposed to a PISA predicted structure) were used for modeling. Interfacial analysis was performed with PISA analysis and is reported in the form of interface area (IA)/Å2, salt bridges (SB), and hydrogen bonds (HB). The largest interface in each complex is represented by a solid black line, the second largest interface in each complex is represented by a gray dashed line, and the smallest interface is represented by a gray dotted line. For products: D, dimer; H, hexamer; M, monomer; P, pentamer; Q, tetramer; T, trimer. For representative SID spectra see SI Appendix. For phosphorylase B the crystal structure is a tetramer; dimer interfaces were predicted from PISA.

