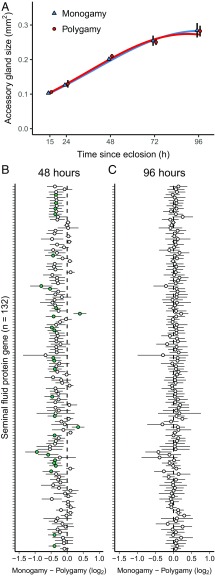
Fig. 3.
(A) Accessory gland size over the first 4 d after eclosion for males from experimentally-evolved monogamous and polygamous populations. Data points are mean (±SE) of three monogamous populations (blue triangles) and three polygamous populations (red circles), and lines indicate predictions from the fit model (n = 8–16 accessory glands per population and age combination). (B) The difference in expression of individual seminal fluid protein genes between males from monogamous and polygamous populations (log2 monogamy–log2 polygamy) at 48 and 96 h post eclosion. Error bars indicate 95% confidence intervals, and green circles indicate genes that are significantly different between monogamy and polygamy at 10% FDR (27 genes at 48 h, 0 genes at 96 h).

