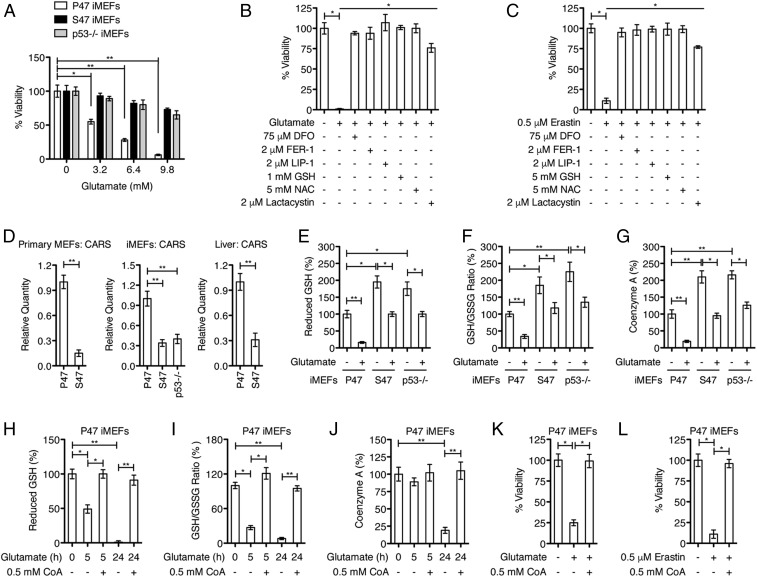
Fig. 1.
Effect of codon 47 variants on sensitivity to glutamate toxicity and redox environment. (A) Cells, as indicated, were treated for 24 h with increasing concentrations of glutamate, and cell viability was assayed. Data represent the mean ± SD of multiple experiments (*P < 0.05, **P < 0.01). (B) P47 iMEFs were treated with PBS or 9.8 mM glutamate, with or without the indicated compounds, for 24 h, and analyzed for viability. Means and SD are shown (n = 4, *P < 0.05). (C) P47 iMEFs were treated with DMSO or 0.5 μM erastin, with or without the indicated compounds, for 24 h, and analyzed for viability. Means and SD are shown (n = 4, *P < 0.05). (D) qRT-PCR analyses of CARS in primary MEFs, iMEFs, and livers, as indicated. Relative expression data are plotted as the mean ± SD of multiple experiments (**P < 0.01). (E–G) iMEFs were treated with PBS or 6.4 mM glutamate for 24 h, as indicated. Cells were collected, washed with PBS, and analyzed for reduced GSH, GSH/GSSG ratio, and CoA abundance. Means and SD are shown (n = 4, *P < 0.05, **P < 0.01). (H–J) P47 iMEFs were treated with PBS, 9.8 mM glutamate, or 9.8 mM glutamate plus 0.5 mM CoA for 5 h or 24 h, as indicated. Intracellular levels of reduced GSH, GSH/GSSG ratio, and CoA abundance were determined. Means and SD are shown (n = 4, *P < 0.05, **P < 0.01). (K) P47 iMEFs were treated with PBS or 6.4 mM glutamate, with or without indicated 0.5 mM CoA, for 24 h, and analyzed for viability. Means and SD are shown (n = 4, *P < 0.05). (L) P47 iMEFs were treated with DMSO or 0.5 μM erastin, with or without indicated 0.5 mM CoA, for 24 h, and analyzed for viability. Means and SD are shown (n = 4, *P < 0.05).

