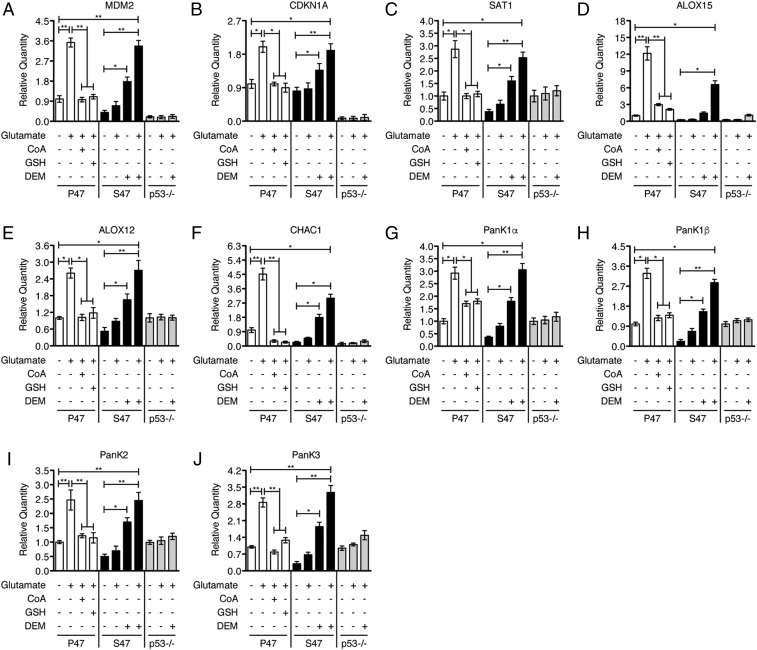
Fig. 2.
Effect of GSH or CoA change on gene expression in response to glutamate. (A–J) qRT-PCR analyses of the indicated genes in P47, S47, and p53-null (p53−/−) iMEFs. P47 iMEFs were pretreated with 0.5 mM CoA or 1 mM GSH for 2 h followed by 6.4 mM glutamate for 5 h. S47 and p53-null (p53−/−) iMEFs were treated with 6.4 mM glutamate, 50 μM DEM, or 6.4 mM glutamate + 50 μM DEM, as indicated, for 5 h. P47, S47, and p53−/− iMEFs treated with PBS served as controls. Relative expression data are plotted as the mean ± SD (n = 3, *P < 0.05, **P < 0.01).

