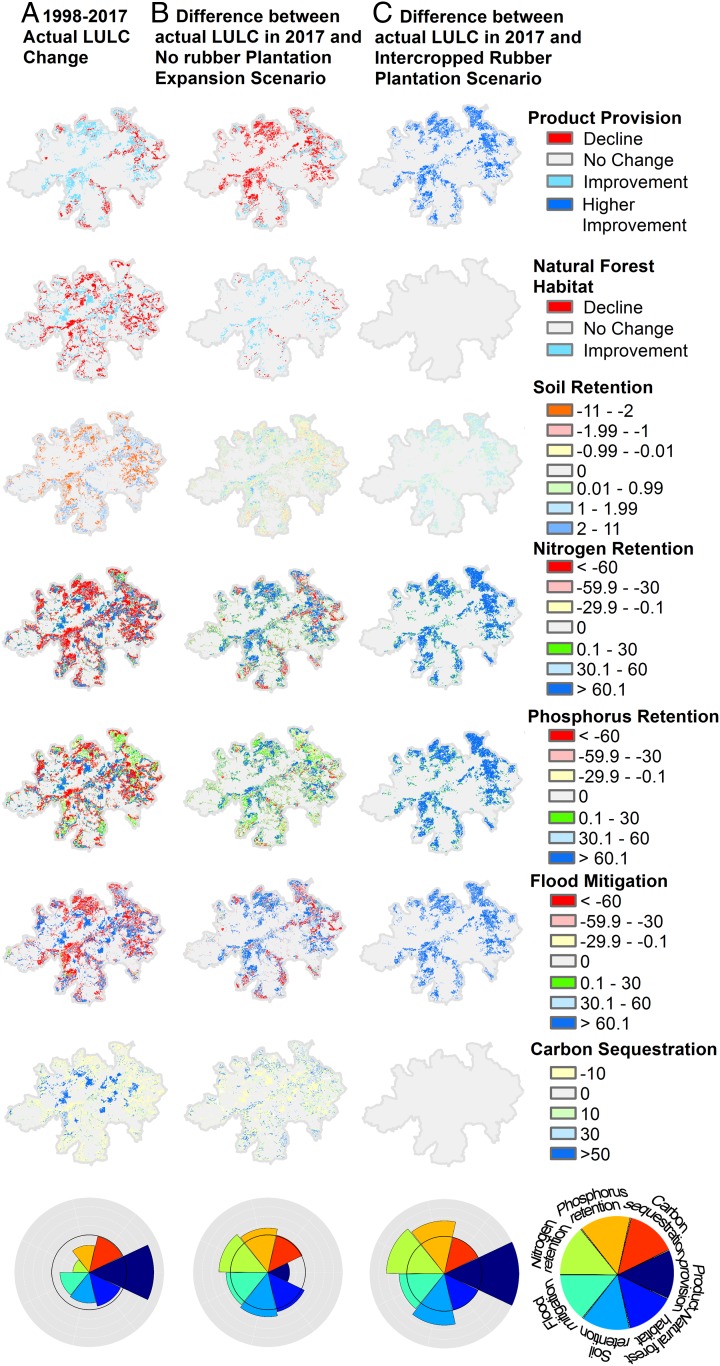
Fig. 4.
Impacts of LULC changes and the implications of alternative land management scenarios on ecosystem services across the landscape. (Upper) (A) Changes in ecosystem services are relative to the actual change over 1998–2017, involving expansion of conventional rubber production, with declines in ecosystem services shown in red, increases shown in blue, and gray representing no change. (B) The implications for 2017 had there been no rubber expansion from 1998, compared with 2017. (C) The implications for 2017 had there been a shift of all monoculture rubber plantation in 2017 to Intercropped Rubber Plantation. (Lower) The circles show ecosystem service provision under each scenario, relative to the baseline (the black circle in each diagram). A longer petal indicates higher production of a particular service.

