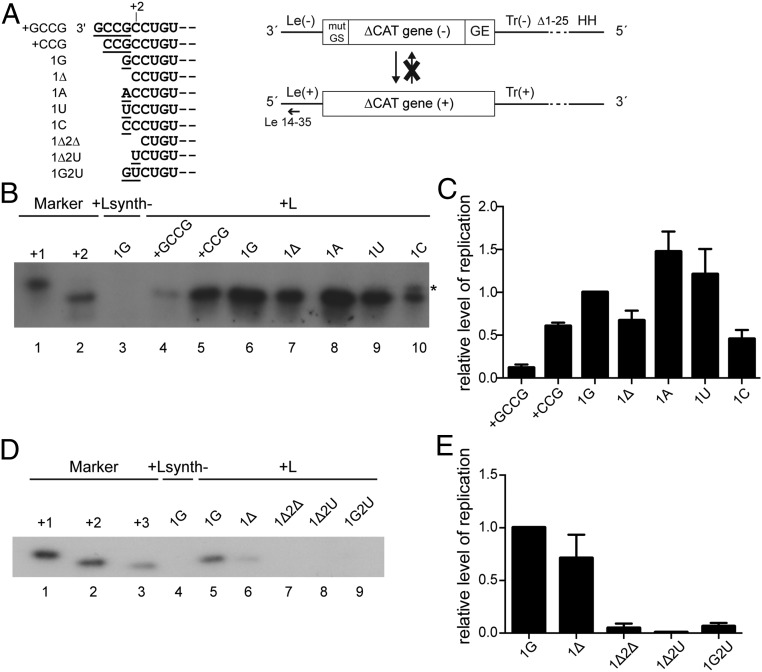
Fig. 4.
Analysis of replicated RNA produced from EBOV minigenomes with different 3′ ends. (A) Schematic diagram (not to scale) showing the different 3′ terminal sequences that were tested (Left) and the organization of the single-cycle replicating, nontranscribing EBOV minigenome and the antiminigenome product (Right). The terminal 25 nucleotides of the trailer were deleted (Δ1–25). The trailer is flanked by an inactive hammerhead ribozyme (HH). The annealing position of the negative sense primer used for primer extension is indicated; mut GS, mutated gene start signal; GE, gene end signal. (B) Primer extension analysis of antiminigenome RNA from minigenomes with +GCCG, +CCG, 1G, 1Δ, 1A, 1U, and 1C 3′ ends using a negative sense primer that annealed within the Le(+) region. The markers are [γ-32P]ATP end-labeled DNA oligonucleotides corresponding in length and sequence to cDNA representing initiation from positions +1 and +2, relative to published sequence. As a negative control, L was replaced with the enzymatically inactive Lsynth- mutant (52). A representative result of three independent experiments is shown. (C) Quantification of primer extension products shown in B. The data are normalized to the level of product generated by the 1G minigenome after subtraction of the Lsynth- negative control. Shown are the mean and SE of three independent experiments. (D) Primer extension analysis of antiminigenome RNA from minigenomes with 1G, 1Δ, 1Δ2Δ, 1Δ2U, and 1G2U 3′ ends using a negative sense primer that annealed within the Le(+) region. The markers are [γ-32P]ATP end-labeled DNA oligonucleotides corresponding in length and sequence to cDNA representing initiation from positions +1, +2, and +3 relative to published sequence. As a negative control, L was replaced with the enzymatically inactive Lsynth- mutant (52). A representative result of three independent experiments is shown. (E) Quantification of primer extension products shown in D. The data are normalized to the level of product generated by the 1G minigenome after subtraction of the Lsynth- negative control. Shown are the mean and SE of three independent experiments.

