Fig. 3.
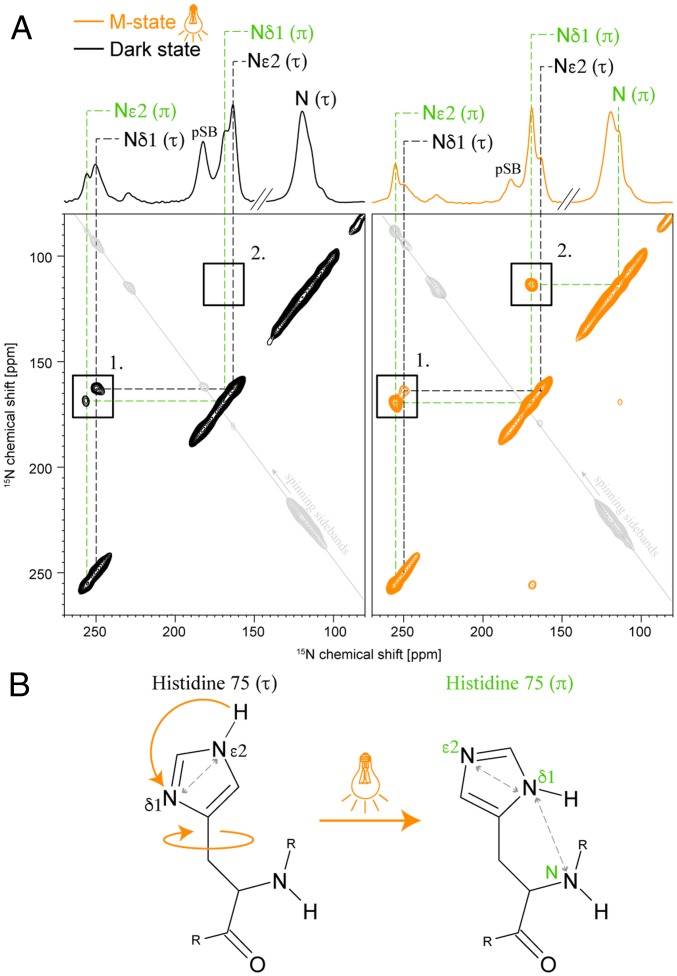
Conformational changes of H75 in the M state. (A) 15N-15N PDSD spectra of (13C6-15N3-His, 15Nε-Lys)-GPRE108Q in the dark state (Left, black) and illuminated M state (Right, orange). (τ)-state signals are labeled in black, and (π)-state signals are labeled in green. (1) Short-range contact between Nε2 and Nδ1 within the imidazole ring. The (τ) and (π) peaks swap intensities after illumination, confirming the change to a dominant (π) population in the M state. (2) The occurrence of a Nδ1(π)-N(π) cross peak in the M state indicates the close proximity between these nuclei. (B) 15N-15N PDSD spectra suggest that H75 in the M state changes not only its tautomerization from (τ) to (π) but also the orientation of its side chain. The observed close proximity between Nδ1(π) and N(π) could be explained by a rotation around the Cβ–Cγ bond. Spectra were recorded with a mixing time of 1 s. The asymmetry in cross-peak intensities is caused by longitudinal relaxation differences between the coupled spins, which is slow compared with the recycle delay times used here. Signals in gray are caused by back-folded spinning sidebands due to the reduced spectral width used for spectra acquisition.

