Fig. 2.
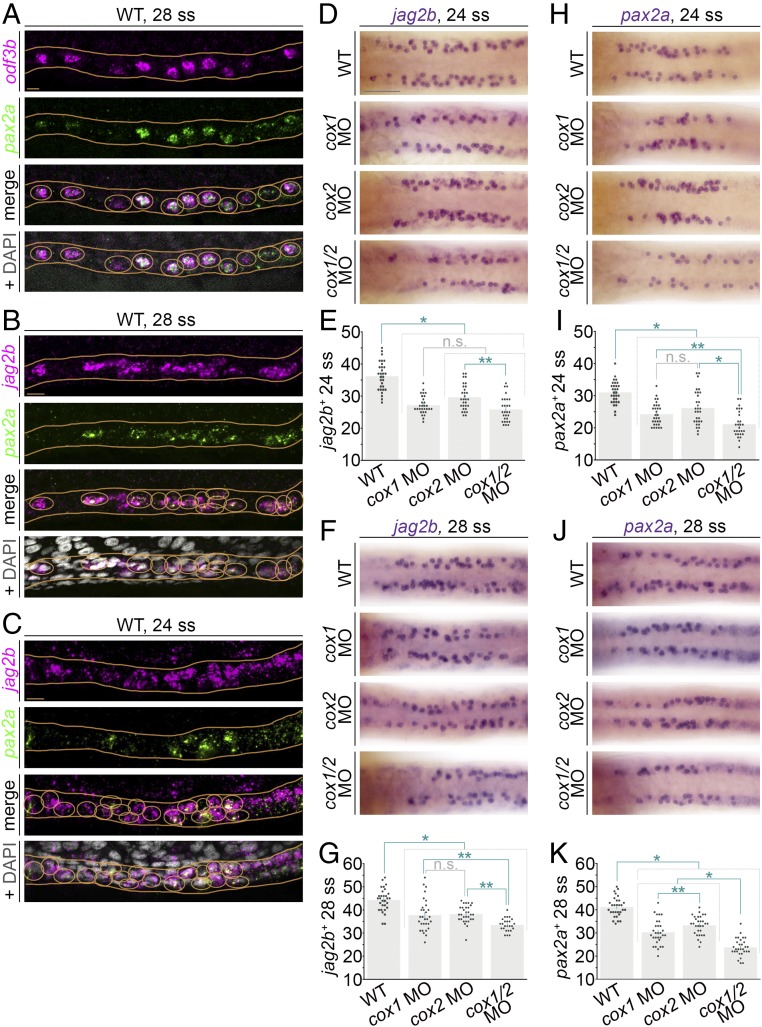
Deficiency of prostaglandin biosynthesis leads to decreased renal MCC progenitor number in the zebrafish pronephros. (A–C) FISH in representative WT embryos at the 28 ss reveals (A) colocalization of odf3b transcripts (magenta) and pax2a transcripts (green), and (B and C) that jag2b and pax2a are coexpressed in a salt-and-pepper fashion in the nephron at the (B) 28 ss and (C) 24 ss. Images are maximum image projections. Nephron cells with colocalization of transcripts are circled in orange, and nephron tubules are outlined with orange lines. (A–C, Bottom) Orange circles are around nuclei to indicate the scoring of representative cells that exhibit colabeling of the markers. (Scale bars, 10 μm.) (D and F) jag2b transcript expression at the (D) 24 and (F) 28 ss in representative WT controls and cox-deficient embryos as visualized by WISH. Images are dorsal views of the pronephros. (Scale bar, 50 μm.) (E and G) Quantification of jag2b+ pronephros cells at the 24 and 28 ss. (H and J) Expression of pax2a at the 24 and 28 ss in representative WT controls and cox-deficient embryos as visualized by WISH. Images are dorsal views of the pronephros. (I and K) The average number of pax2a+ cells per pronephros at the (I) 24 and (K) 28 ss is quantified in graphs. For D, F, H, and J, scored cells are indicated by the overlay of an opaque purple dot. For E, G, I, and K, each dot represents the total number of jag2b+ or pax2a+ cells between somites 8 and 12 of one pronephros. Data are represented as mean ± SEM; significance was determined by ANOVA, where *P < 0.0001, **P < 0.05, n.s., not significant.

