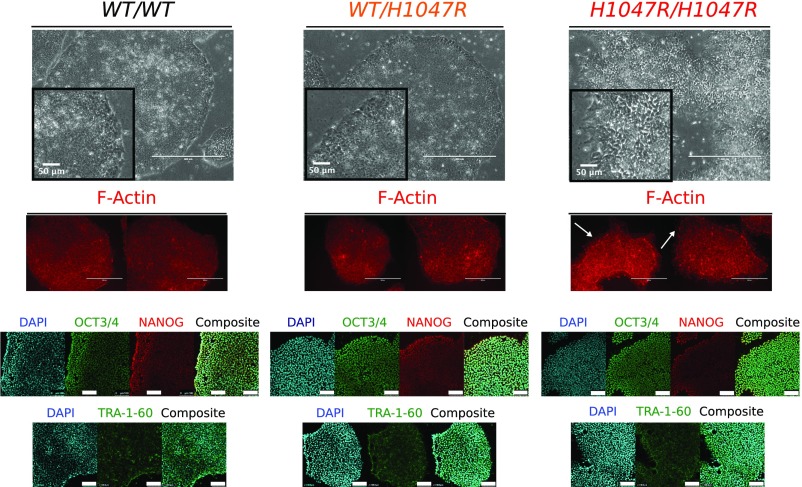
Fig. 1.
Isogenic hPSCs expressing PIK3CAH1047R from one or both endogenous alleles. Representative light microscopy and immunofluorescence images of stem cell colonies from cultures with the indicated genotypes. F-Actin staining was used to visualize cell shape, and arrows highlight altered edge morphology and F-Actin–rich protrusions in PIK3CAH1047R/H1047R colonies. (Scale bars: 400 µm; Insets, 50 µm.) Light micrograph images are representative of multiple clones from each genotype (4 WT, 3 PIK3CAWT/H1047R, and 10 PIK3CAH1047R/H1047R). The confocal images are of WT and mutant cells stained with antibodies against OCT3/4, NANOG, and TRA-1-60. Images are representative of at least two independent experiments and clones per genotype. (Scale bar: 100 µm.) See also SI Appendix, Fig. S1.

