Fig. 2.
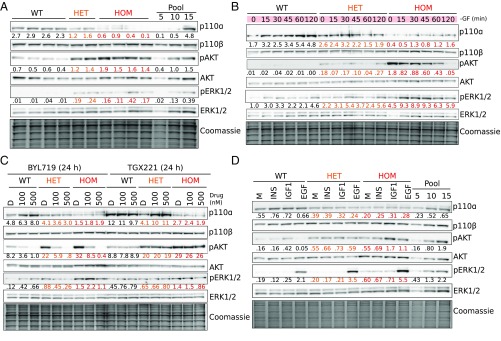
Graded activation of PI3K signaling in PIK3CAH1047R hPSCs. Immunoblots are shown for p110α and p110β catalytic subunits of PI3K, and for total and phosphorylated AKT (S473) and ERK1/2 (T202/Y204; T185/Y187), with Coomassie-stained gels after transfer as loading control. Numbers below bands indicate quantification by densitometry (arbitrary units). (A) Signaling in cells collected 3 h after replenishment of growth factor (GF)-replete medium. Representative of at least three independent experiments. (B) Signaling time course during short-term GF depletion. Representative of at least two independent experiments. (C) Effects of 24 h of specific p110α or p110β inhibition in GF-replete medium using BYL719 or TGX221, respectively. DMSO (D) was used as control. Representative of two independent experiments. (D) Response of cells to 2 h of GF depletion followed by 20-min stimulation with 10 nM insulin (INS), insulin-like growth factor 1 (IGF1), or epidermal growth factor (EGF). GF-free DMEM/F12 medium (M) was used as control. The results are representative of two independent experiments. In all cases, independent clones of the same genotypes were used for replicate experiments. Protein pool dilutions are included where possible to assess assay performance (numbers represent micrograms). WT, wild type; HET, PIK3CAWT/H1047R; HOM, PIK3CAH1047R/H1047R. See also SI Appendix, Fig. S2.

