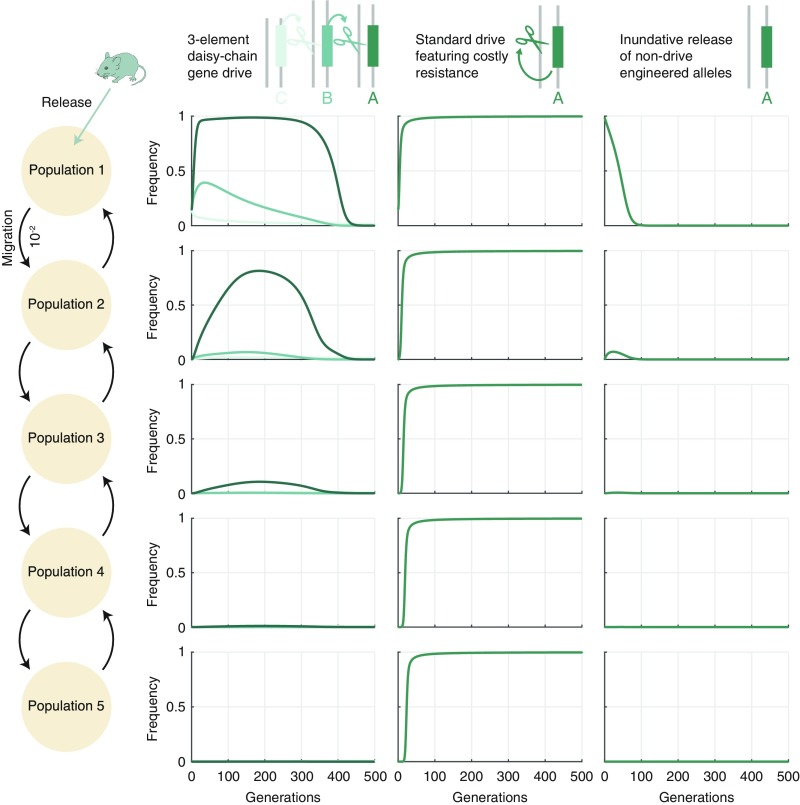
Fig. 4.
Modeling daisy-drive containment in a system of populations connected by gene flow. (Left) Illustration of the population structure: Five populations with equal sizes are connected in a chain, and each neighboring pair has bidirectional gene flow with rate in each direction. The three columns in Right then correspond to the three scenarios described in the text: CBA daisy-chain drive (first column), self-propagating (“standard”) drive with multiple gRNAs targeting an essential gene, as in ref. 17 (second column), and nondrive inundative release (third column). Frequencies over time are indicated for each allele in each of the populations. Drive-based simulations (daisy chain and standard) assume homing efficiency, dominant cargo element fitness cost, and release frequency. Daisy-chain drive simulations further assume upstream element (C, B) fitness cost. Inundative release simulations assume dominant fitness cost and release. See SI Appendix, section 5 for details.

