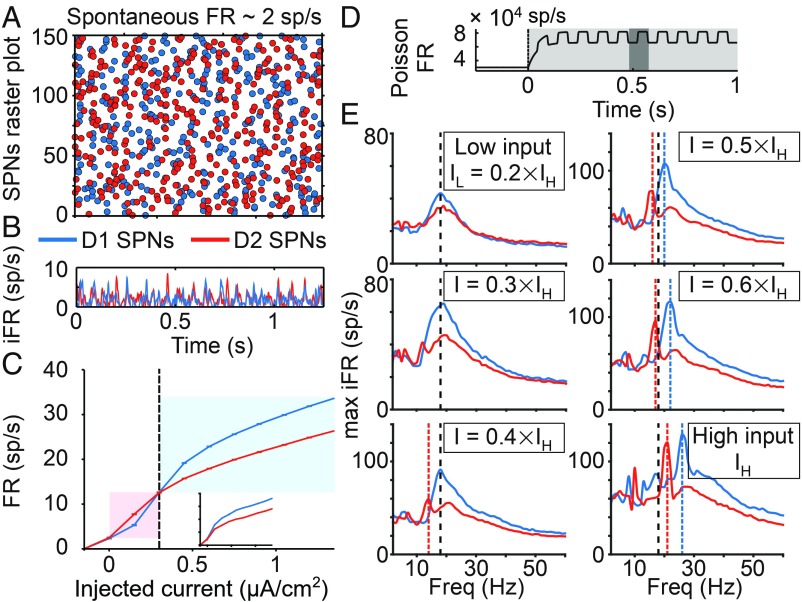
Fig. 3.
D1 and D2 SPNs respond differently to the same input. (A) Raster plot of the spontaneous activity of SPNs. (B) Instantaneous firing rate (iFR; average firing of the population varying in time) of SPNs. (C) Averaged f–I curve of each neuronal ensemble (input–output transfer function between injected current, as in Fig. 2C, Upper, and time-averaged population FR). The higher excitability of D2 SPNs is shaded in red. The higher excitability of D1 SPNs is shaded in blue. (Inset) The f–I curve when the injected current is applied only to a single cell of each population. (D) Rate of the Poisson process underlying the stochastic oscillatory input to the striatal circuit: when the stimulus is on (shaded in light gray), the rate increases and oscillates at a given frequency (inverse of the period, which appears shaded in dark gray). (E) Resonance of SPNs for different inputs strengths. The resonance in each panel is quantified in terms of maximum iFR, a measure of local population synchronization: across input frequencies (x axis), the average of the peak iFR through all cycles is computed (y axis). Resonant frequencies are highlighted by vertical lines. Black dashed lines represent the resonance of D1 and D2 SPNs at low input strength. Blue and red dashed lines represent shifts in resonance for D1 and D2 SPNs, respectively.

