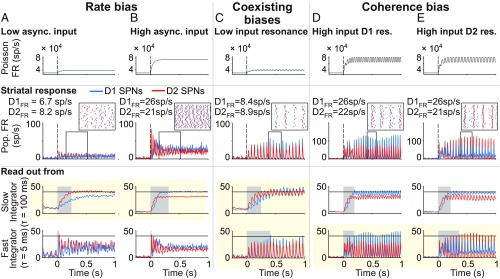
Fig. 4.
Three mechanisms flexibly and reliably bias the striatal circuit under balanced input: rate, coherence, and coexisting biases. Rate bias: A vs. B. (A and B) Biasing between GO and NO-GO pathways depends on the overall strength of the balanced cortical input. (Top) Rate of the Poisson process underlying the stochastic asynchronous input to the striatum. (Middle) Population FR [instantaneous firing rate (iFR)]. (Inset) Raster activity of (n = 20) D1 and D2 SPNs (the time window is indicated by the black frame in Middle). (Bottom) Downstream readout of the activity of SPNs using distinct integration timescales. Only slow timescale integration shows flexibility in biasing GO and NO-GO actions (highlighted with the yellow background). Response time is shaded in light gray. Response threshold is at 40 sp/s (solid horizontal lines). (C) Coexisting biases. Biasing between GO and NO-GO pathways under balanced inputs of low strength depends on resonant properties of SPNs and a dynamic tuning of readout timescale. (Top) Rate of the Poisson process underlying the stochastic oscillatory input to the striatal circuit that matches the resonant frequency of SPNs. (Middle) Population FR (iFR; amplitude of which is a measure of local population synchronization). (Inset) Raster activity of (n = 20) D1 and D2 SPNs (the time window i0s indicated by the black frame in Middle). (Bottom) Downstream readout of the activity of SPNs using a distinct integration timescale. On-the-fly tuning of the readout timescale (details are in the text) allows for flexibility in biasing between GO and NO-GO actions (highlighted with the yellow background). Response time is shaded in light gray. Response threshold is at 40 sp/s (solid horizontal lines). Coherence bias: D vs. E. (D and E) Biasing between GO and NO-GO pathways under balanced inputs of high strength depends on resonant properties of SPNs and the spectral content of the cortical input. (Top) Rate of the Poisson process underlying the stochastic oscillatory input to the striatal circuit that matches the resonant frequency of either SPN type. (Middle) Population FR (iFR; the amplitude of which is a measure of local population synchronization; note the higher scale of D and E compared with A–C). (Inset) Raster activity of (n = 20) D1 and D2 SPNs (the time window is indicated by the black frame in Middle). (Bottom) Downstream readout of the activity of SPNs using a distinct integration timescale. Only fast timescale integration shows flexibility in biasing GO and NO-GO actions (highlighted with the yellow background). Response time is shaded in light gray. Response threshold is at 40 sp/s (solid horizontal lines).

