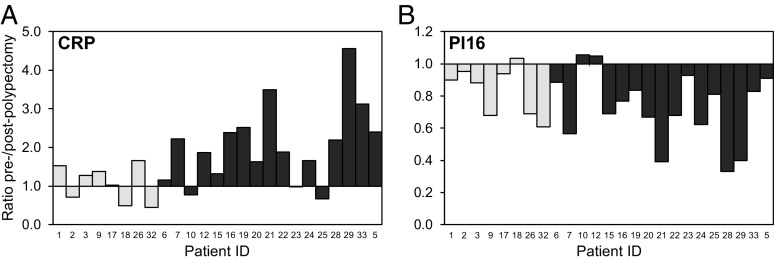
Fig. 4.
Paired-sample analysis of the specificity of biomarkers CRP (A) and PI16 (B). Each bar represents the ratio of prepolypectomy to postpolypectomy values for a single patient case. Patients are presented in the same left-to-right order in the two graphs. Dark gray represents high-risk cases, and light gray represents low-risk cases. CRP prepolypectomy/postpolypectomy ratios in high-risk cases were significantly different compared with low-risk cases (P = 0.013, Mann–Whitney U test). The PI16 prepolypectomy/postpolypectomy ratios did not significantly differ between high-risk and low-risk cases (P = 0.28, Mann–Whitney U test).

