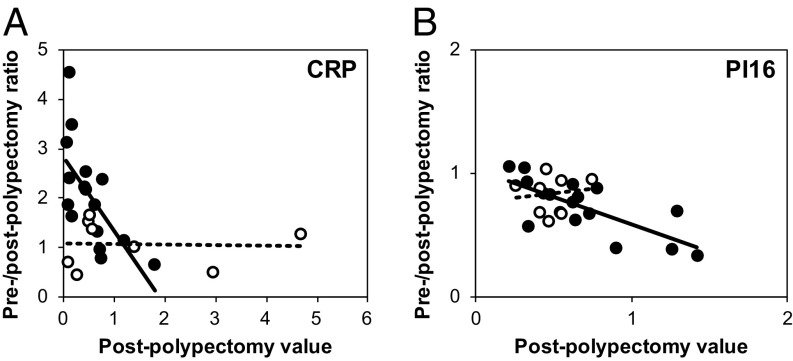
Fig. 5.
Paired-sample analysis of CRP (A) and PI16 (B) vs. ambient biomarker level. For CRP and PI16, the calculated ratios of biomarkers level are plotted against their corresponding baseline, expressed as the postpolypectomy level. Black-filled symbols represent high risk cases; white-filled symbols represent low-risk cases.

