Fig. 1.
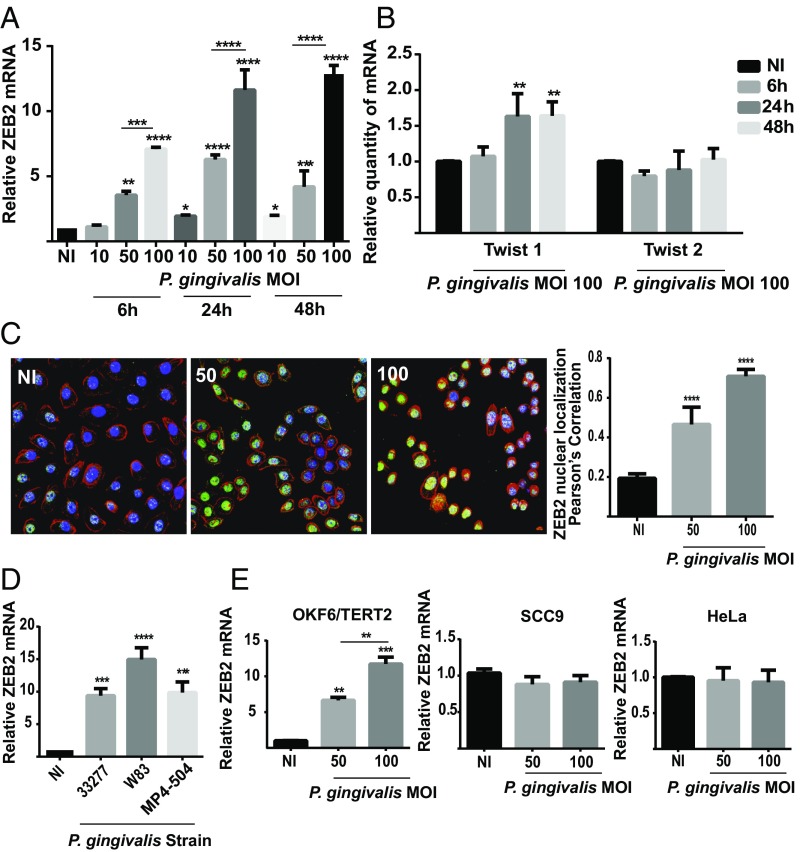
P. gingivalis up-regulates transcription factors controlling EMT. (A and B) TIGK cells were infected with P. gingivalis 33277 at the times and MOIs indicated. ZEB2 (A) or TWIST1/2 (B) mRNA levels were measured by qRT-PCR. Data were normalized to GAPDH mRNA and are expressed relative to noninfected (NI) controls. (C) Fluorescent confocal microscopy of TIGK cells infected with P. gingivalis 33277 (Pg) at the MOI indicated for 24 h. Control cells were noninfected (NI). Cells were fixed and probed with ZEB2 antibodies (green). Actin (red) was stained with Texas Red-phalloidin, and nuclei (blue) were stained with DAPI. Cells were imaged at magnification 63×. Shown are merged images of projections of z-stacks (Left) and Pearson’s correlation coefficient of ZEB2 with nuclei (Right) obtained with Volocity software. (D) TIGK cells were infected with P. gingivalis strains at MOI:100 for 24 h. ZEB2 mRNA levels were determined as in A. (E) ZEB2 mRNA levels in different cell types following P. gingivalis 33277 infection for 24 h. Quantitative data represent three independent experiments with three replicates. Error bars represent the SEM. *P < 0.05, **P < 0.01, ***P < 0.005, and ****P < 0.001, compared with NI unless indicated. Images are representative of three independent experiments.

