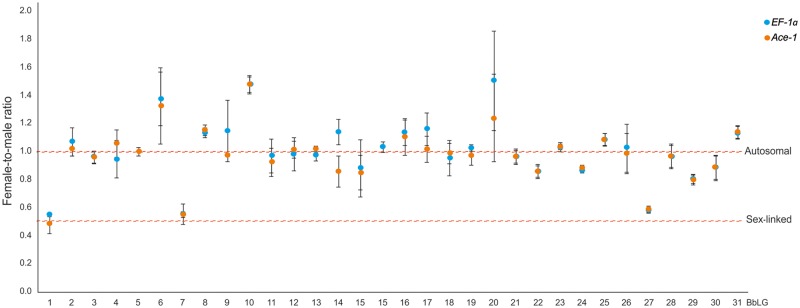
Fig. 3.
—Screening of marker genes in Tuta absoluta by means of qPCR. Blue dots represent the average female-to-male ratio values obtained for each marker using EF-1a as the reference gene. Orange dots are the average values for the same variable obtained using Ace-1 as the reference gene. Whiskers show the SE. Red dashed lines are used to show how each value correlates with 1 (autosomal) and 0.5 (sex-linked) expected female-to-male ratios. Note that most of the data points fluctuate ∼1, except for those corresponding to BbLG1, BbLG7, and BbLG27 which are closer to 0.5 than to 1. BbLG, Biston betularia linkage group.

