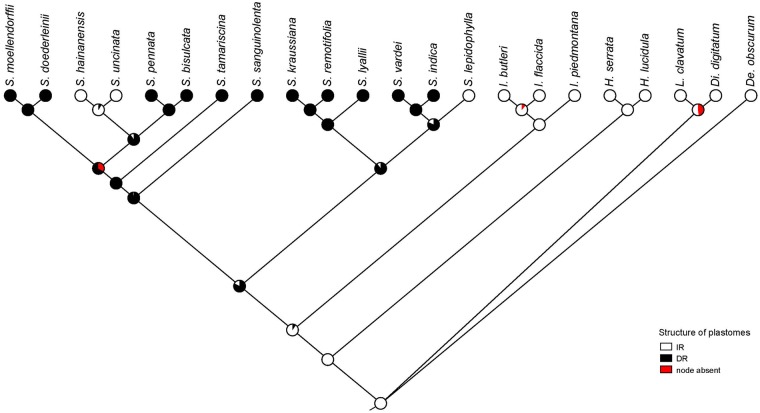
Fig. 7.
—Ancestral states reconstruction of Selaginellaceae plastomes structure reconstructed with maximum likelihood over 1,000 trees obtained in the ML analysis of the plastome data set. Pie charts show the percentage of node absence in the input 1,000 trees and the average likelihood received by each state across all input trees possessing that node.

