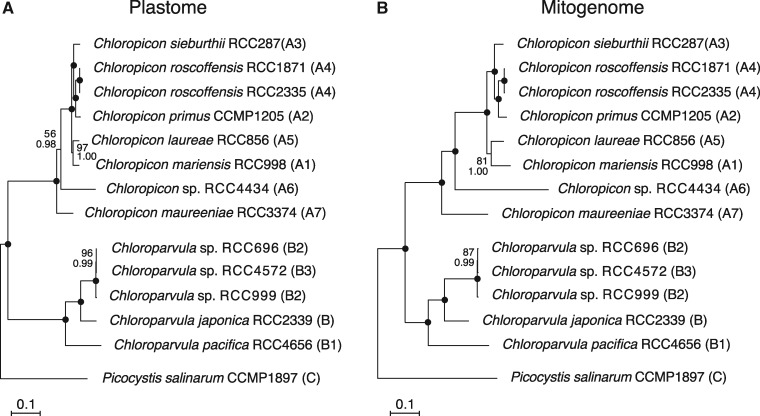
Fig. 1.
—Organelle phylogenomic trees showing the relationships among chloropicophycean taxa. (A) Plastome-based phylogeny inferred from a data set of 102 genes (first and second positions of 71 protein-coding genes, 3 rRNA genes, and 28 tRNA genes). (B) Mitogenome-based phylogeny inferred from a data set of 64 genes (first and second positions of 36 protein-coding genes, 2 rRNA genes, and 26 tRNA genes). The trees shown here are the best-scoring ML trees that were inferred under the GTR + Γ4 model. Support values are reported on the nodes: from top to bottom are shown the bootstrap support (BS) values for the RAxML GTR + Γ4 analyses and the posterior probability (PP) values for the PhyloBayes CATGTR + Γ4 analyses. Black dots indicate that the corresponding branches received BS and PP values of 100%.

