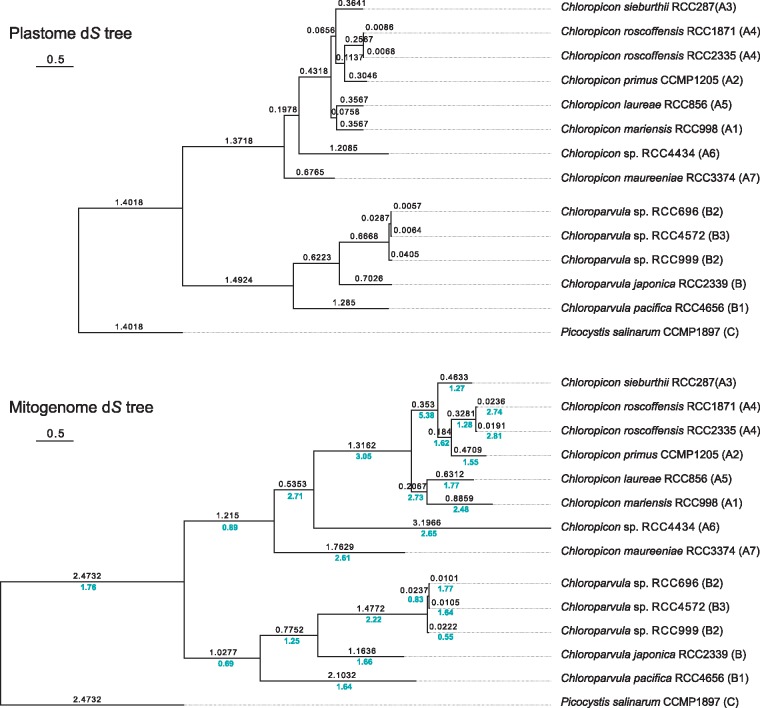
Fig. 2.
—Relative synonymous substitution rates in the organelle genomes of the Chloropicophyceae. Plastome and mitogenome trees based on synonymous substitutions were inferred from codon-aligned sequences of concatenated protein-coding genes using CODEML. In both trees, the number of estimated synonymous substitutions per site (dS value) is shown above each branch. In the mitogenome tree, the ratio of the mitogenome to plastome dS values is indicated in blue below each branch.

