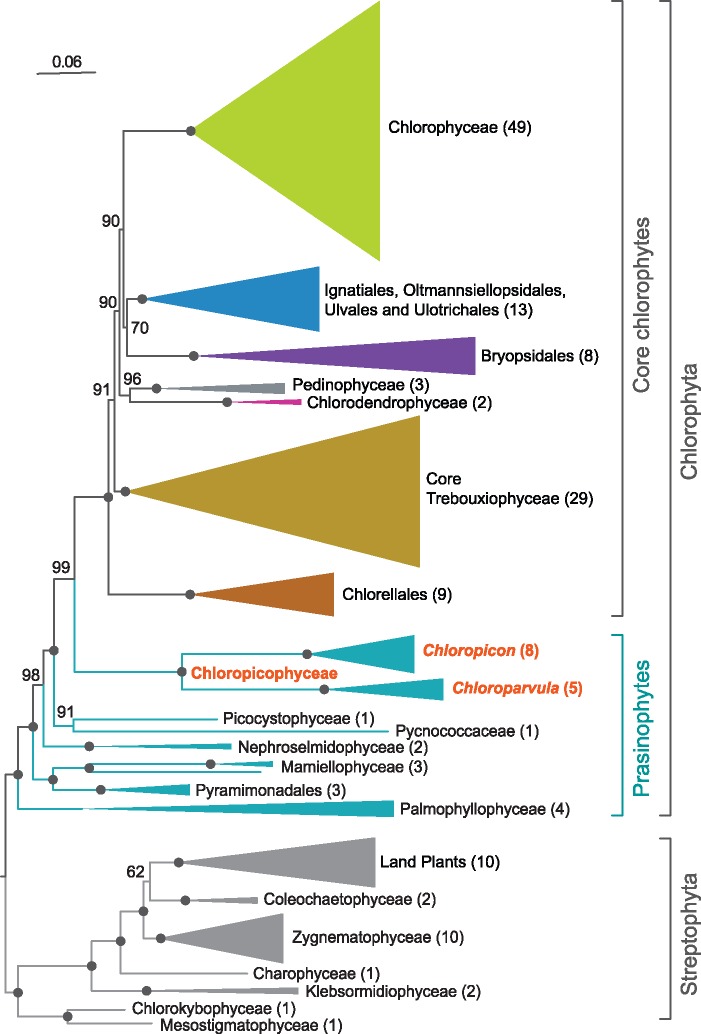
Fig. 3.
—Plastome-based phylogenomic tree showing the position of the Chloropicophyceae relative to other classes and major lineages of the Chlorophyta. This ML tree was inferred from a data set of 79 proteins from 167 green plants using IQ-Tree under the GTR+R4 model. BS values are reported on the nodes. The clades that received maximal support were collapsed and represented as triangles with sizes proportional to the number of taxa (indicated in parentheses). Black dots indicate that the corresponding branches received 100% BS.

