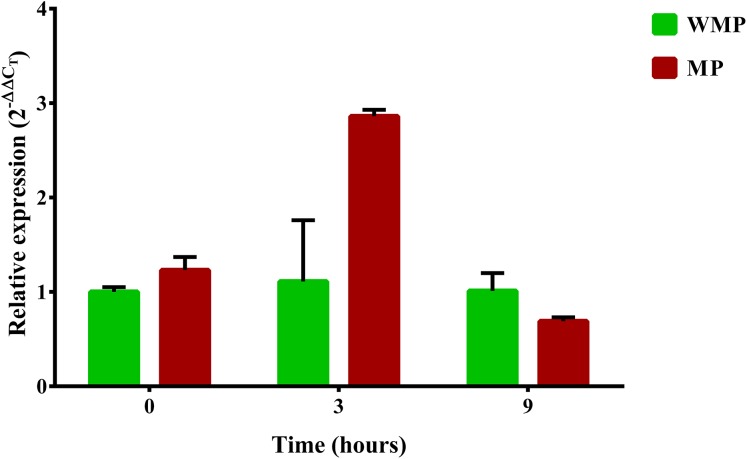
Figure 5. Differential expression of the mpd gene observed by condition and time.
Cells were collected at three sampling times to extract total RNA. The expression level of the mpd gene in MP and MM presence were measured by qRT-PCR and calculated through the 2−ΔΔCT method. Bars in green represent the condition without MP and bars in red the condition with pesticide. The values are averages of results from three independent experiments, error bars represent the standard deviations. According to the results of Unpaired t-test analysis, no significant differences in the relative expression of the gene mpd were found between both experimental conditions at sampling time 0 h (p = 0.0552), in the time 3 h, the relative expression of the gene mpd increased significatively in presence of the pesticide (p = 0.0098) while at sampling time 9 h the relative expression of mpd gene decreased significantly (0.0462) in the same condition. WMP, experimental condition in absence of MP; MP, experimental condition in the presence of MP.

