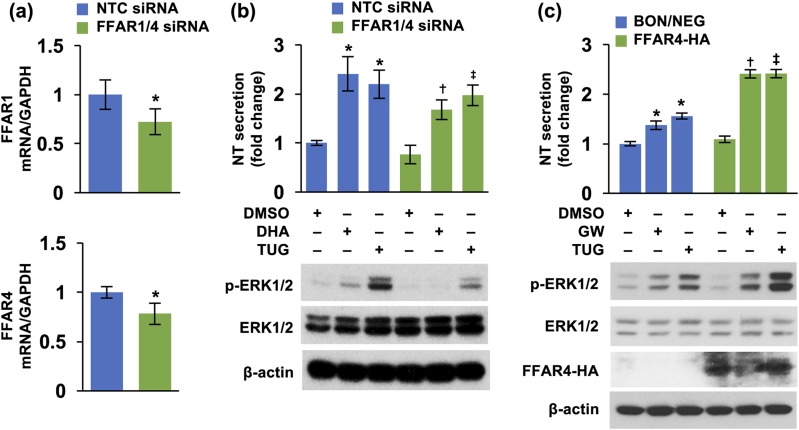
Figure 3.
Double knockdown of FFAR1 and FFAR4 decreased, but overexpression of FFAR4 increased, NT release. (a) BON cells were doubly transfected with FFAR1 (30 nM) and FFAR4 (5 nM) siRNAs and grown for 24 hours. Cells were collected, total RNA extracted, and qPCR performed targeting FFAR1 and FFAR4. *P < 0.05 vs NTC siRNA. (b) BON cells, doubly transfected with FFAR1 and FFAR4 siRNAs, as in (a), were treated with DHA (100 μM) or TUG 891 (10 μM) for 3 hours. Media were collected and NT EIA performed (upper panel); cells were lysed for western blotting analysis (lower panel). Upper panels: *P < 0.05 vs DMSO in NTC siRNA; †P < 0.05 vs DHA in NTC siRNA; ‡P < 0.05 vs TUG 891 in NTC siRNA. (c) BON/NEG and BON/FFAR4-HA cell lines were treated with or without GW 9508 and TUG 891 for 3 hours. Media were collected and NT EIA performed (upper panel) and cells lysed for western blotting analysis (lower panel). Upper panels: *P < 0.05 vs DMSO in BON/NEG; †P < 0.05 vs GW 9508 in BON/NEG; ‡P < 0.05 vs TUG 891 in BON/NEG. All data are mean ± SD. Experiments were repeated at least three times. DMSO, dimethyl sulfoxide; GW, GW 9508; NTC, nontargeting control; TUG, TUG 891.

