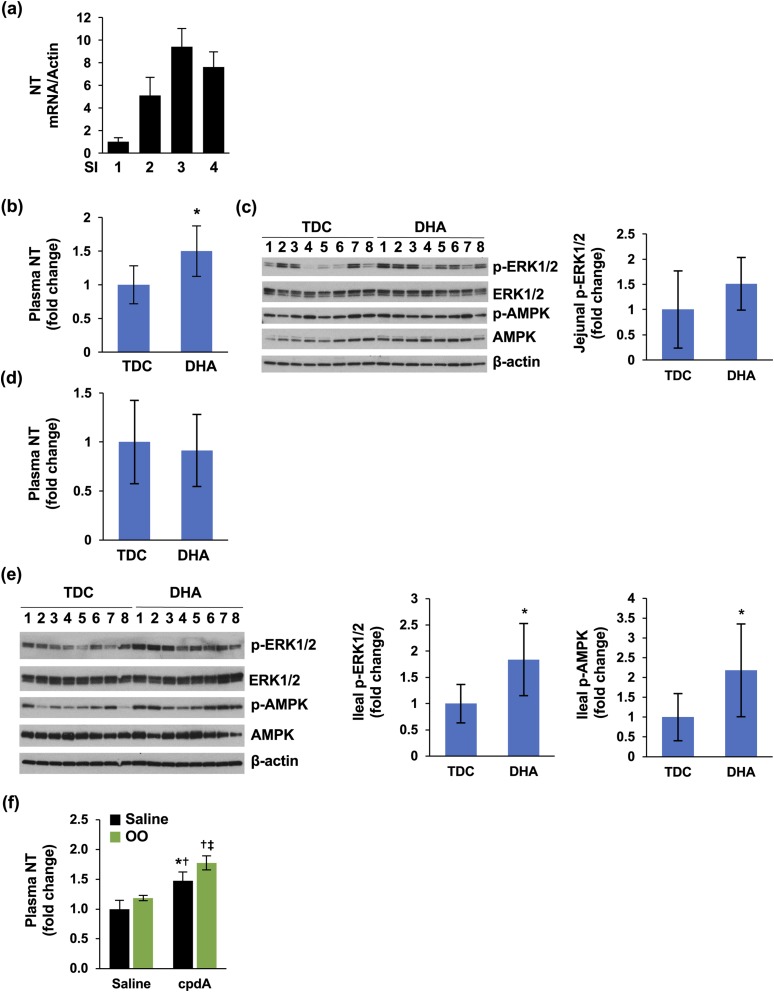
Figure 4.
NT release in vivo. (a) SIs of C57BL/6 mice were divided into four fragments. Mucosa was scraped, total RNA isolated, and qPCR performed targeting mouse NT. (b) Jejunal perfusions were performed and plasma NT measured by NT EIA; TDC (vehicle), n = 8; DHA, n = 9. *P < 0.05 vs TDC. (c) Scraped mucosa from (b) were analyzed by western blot (left panel). Intensity of p-ERK was analyzed by ImageJ software and normalized with total ERK. (d) Ileal perfusions were performed and plasma NT measured by NT EIA. TDC (vehicle), n = 8; DHA, n = 9. (e) Scraped mucosa from (d) were analyzed by western blot (left panel). Intensity of p-ERK (middle panel) and p-AMPK (right panel) was analyzed by ImageJ software and normalized with total ERK or AMPK. (f) C57BL/6 mice were gavaged with saline or cpdA for 1 hour, followed by saline or OO for 30 minutes. Plasma NT was measured by NT EIA. N = 3 mice per group. *P < 0.05 vs saline alone; †P < 0.05 vs olive oil alone; ‡P < 0.05 vs cpdA alone. All data represent mean ± SD. OO, olive oil; SI, small intestine; TDC, taurodeoxycholate.

