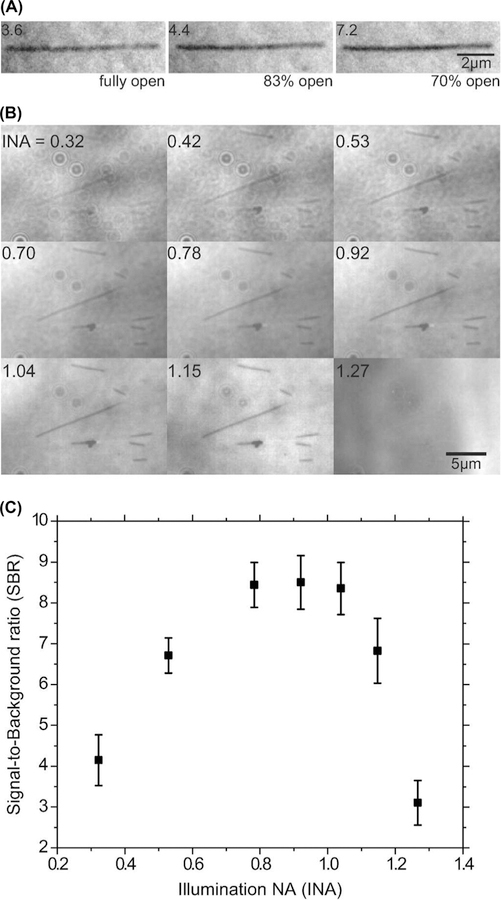
Fig. 1.
Optimal microscope settings for IRM. (A) The same microtubule imaged at three different field diaphragm openings, without background subtraction. The illumination was adjusted such that the average image intensity is nearly the same in all three images. Numbers at the upper corner are the measured SBRs of the microtubule. (B) The same field of view was imaged at different illumination NAs (INA, top left corner), without background subtraction. Again, the intensity was adjusted to give nearly equal illumination levels. (C) SBR as a function of illumination NA for the same field of view as in B, calculated after background subtraction.

