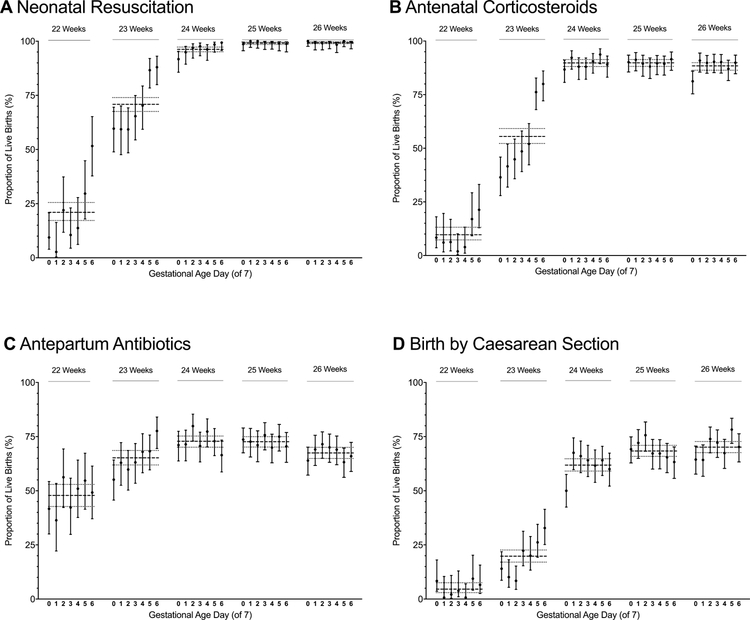
Figure 3. Rates of obstetric interventions and resuscitation by gestational age in weeks and days.
Point values represent the proportion of live births at the specified gestational age in days that received the specified intervention. Vertical bars represent 95% CIs for these estimates. Horizontal dashed lines represent the proportion of births born at a given gestational age week with the specified intervention. The dotted lines on either side of the dashed lines represent the 95% CIs for these estimates. A, Rates of neonatal resuscitation; B, Rates of antenatal corticosteroids exposure (at least 1 dose of antenatal corticosteroids, regardless of timing, prior to birth); C, Rates of antepartum antibiotics (maternal receipt of antibiotics during the current hospitalization and prior to birth); D, Rates of birth by cesarean delivery. Panel A has been modified from Rysavy et al.6

