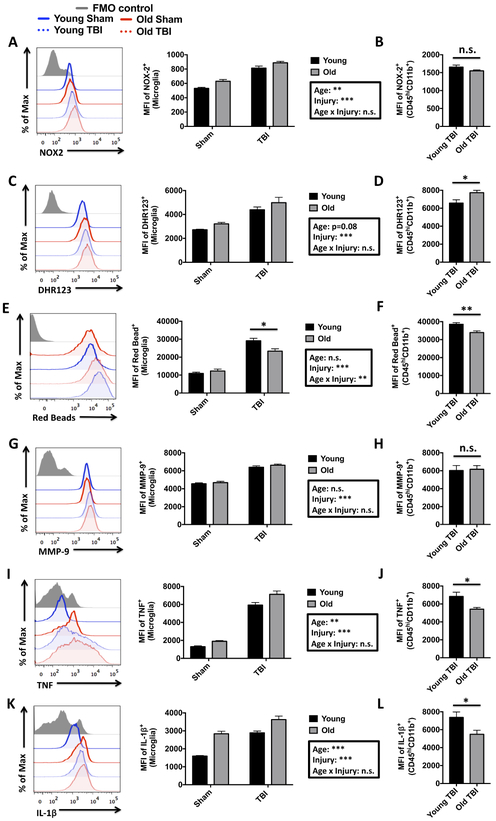
Figure 3. Age-related changes in the functional response of microglia and infiltrating myeloid cells after acute TBI.
A representative histogram depicts the relative expression level of NOX2 in brain-resident microglia (A). The MFI of NOX2-positive microglia is shown to the right, demonstrating an effect of age and injury in microglial expression. No change was seen in NOX2 MFI between young and aged CD45hiCD11b+ infiltrating myeloid populations after TBI (B). A representative histogram shows the relative production level of reactive oxygen species, as measured by DHR123 (C). MFI Quantification of DHR123-positive cells reveal a significant effect of injury on microglial-derived ROS production. A comparison of DHR123 MFI in young and old infiltrating myeloid cells is shown (D). A representative histogram illustrates the relative differences in the phagocytic uptake of fluorescent red beads in young and old microglia after TBI (E). To the right, the MFI quantification of red bead-positive microglia in young and old mice demonstrates that the relative level of phagocytosis induced by TBI is reduced in older microglia populations. The relative level phagocytic activity in young and old infiltrating myeloid cells is shown (F). A representative histogram depicts the relative expression level of MMP-9 in brain myeloid cells (G). MFI quantification of MMP-9-positive microglia is shown for young and aged mice at three days after TBI. No difference in relative MMP-9 expression between young and old infiltrating myeloid populations was found (H). A representative histogram shows the relative expression level of TNF (I). MFI Quantification of TNF-positive cells show a significant increase in microglia with both injury and age. An agerelated decrease in TNF production was in the infiltrating myeloid population after TBI (J). A representative histogram illustrates the relative expression level of IL-1β (K). To the right, MFI quantification of IL-1β-positive microglia demonstrates a significant effect of both age and injury. The relative production level of IL-1β is shown for infiltrating myeloid populations (L). For all experiments, N=4 sham and N=6 TBI/group. Statistical comparisons between groups were determined by two-way ANOVA analysis with Tukey’s multiple comparisons test. Significant group effects of age, injury, and interaction between age and injury are shown in each box. Error bars show mean SEM. Abbreviation: FMO fluorescence minus one, MFI mean fluorescence intensity, MMP-9 matrix metalloproteinase-9, NOX2 NADPH oxidase 2, DHR123 dihydrorhodamine 123, TNF tumor necrosis factor, IL-1β interleukin-1 beta, TBI traumatic brain injury, n.s. not significant, SEM standard error of mean. *p<0.05, **p<0.01, and ***p<0.001

