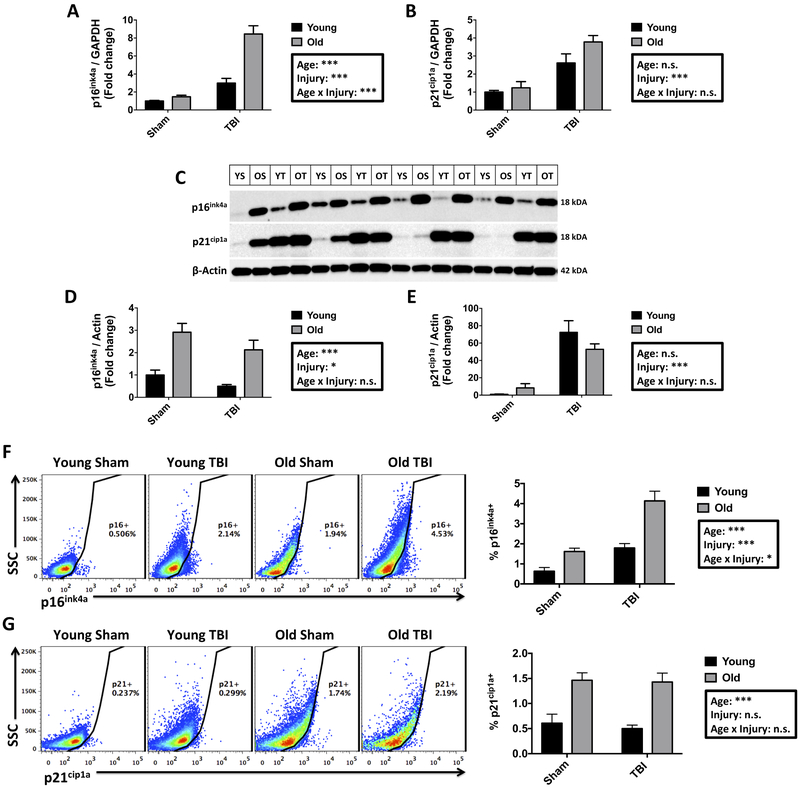
Figure 5. Gene and protein expression of senescence markers in the aging cortex and microglia following acute TBI.
Relative gene expression was determined by qPCR and expressed as fold change to young naïve levels. A significant interaction was seen between age and injury in tissue expression of p16ink4a (A). A significant effect of injury was seen in the gene expression level of p21cip1a (B). Representative Western blot images are shown for p16ink4a, P21cip1a, and Actin expression using whole cell lysate from cortical tissue of young and aged sham and TBI mice at 72 hrs after injury (C). Quantification of densitometric analysis revealed an effect of both age and injury on the relative expression of p16ink4a protein (D). The relative expression level of p21cip1a protein was increased with injury in both groups (E). Representative dot plots show the percentage of p16ink4a-positive microglia (F). Percent quantification of p16ink4a-positive microglia shows a significant interaction, including a group effect of both age and injury. Representative dot plots show the percentage of p21cip1a-positive microglia (G). A significant group effect of age, but not injury was seen in the percent quantification of p21cip1a-positive microglia. For all experiments, N= 4-6/group. Statistical comparisons between groups were determined by two-way ANOVA analysis with Tukey’s multiple comparisons test. Significant group effects of age, injury, and interaction between age and injury are shown in each box. Error bars show mean SEM. Abbreviation: TBI traumatic brain injury, SEM standard error of mean. *p<0.05, **p<0.01, and ***p<0.001

