Figure 1:

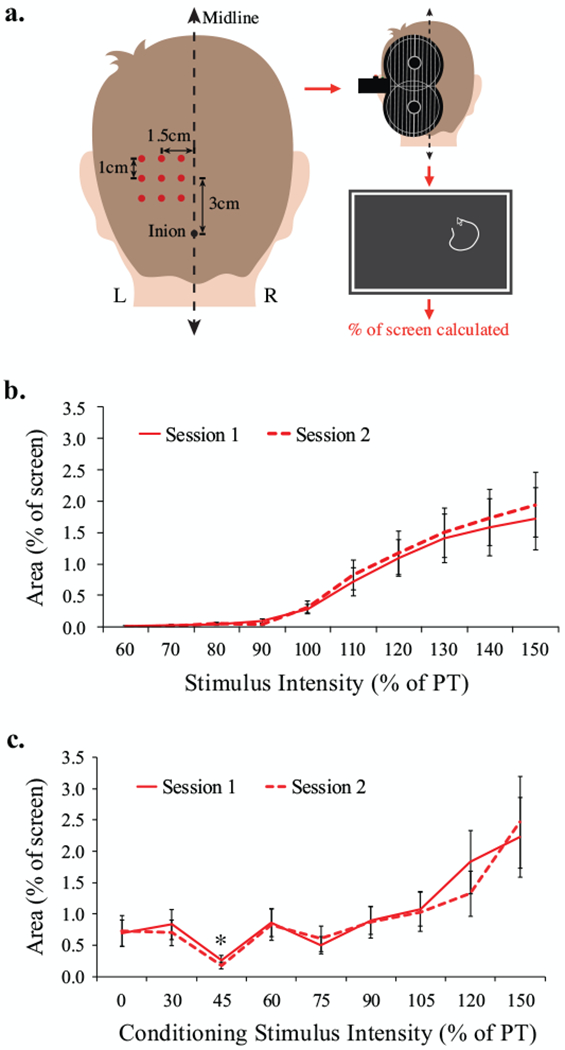
a. Grid placement over the visual cortex to elicit phosphenes through transcranial magnetic stimulation (TMS). Stimulation targets were spaced 1cm apart, with the center of the grid 3cm dorsal and 1.5 cm left-lateral of the inion. Stimulator output was initially set to 60% of maximum stimulator output and each target was stimulated three times (monophasic, lateral-medial induced current, MagPro X100 with MagOption stimulator and MC-B70 butterfly coil). If no phosphenes were induced, intensity was increased in increments of 10% until phosphenes were reported. If phosphenes were reported at one or more locations, the site reported to generate the brightest most consistent phosphenes was selected as the target “hotspot”. At the hotspot, stimulation intensity was decreased by 2% of stimulator output until no longer reported, then incremented by 1% until the phosphene threshold (PT) was reached. PT was defined as the lowest stimulator output at which at least 5 out of 10 stimuli induced a phosphene. If no phosphenes were reported at any of the 9 locations with 100% of stimulator output, the participant was excluded from further participation (n=7). The TMS coil was held at 90° to the midline. The BrainSight™ frameless stereotactic neuronavigation system was used for accuracy of targeting and trajectory. Subjects traced phosphenes on screen after each trial and area was calculated. b. Phosphene area as a function of stimulator intensity during single-pulse TMS. Error bars indicate standard error of the mean. c. Phosphene size as a function of conditioning stimulus intensity during paired-pulse TMS. Error bars indicate standard error of the mean. Asterisk denotes significant inhibition.
