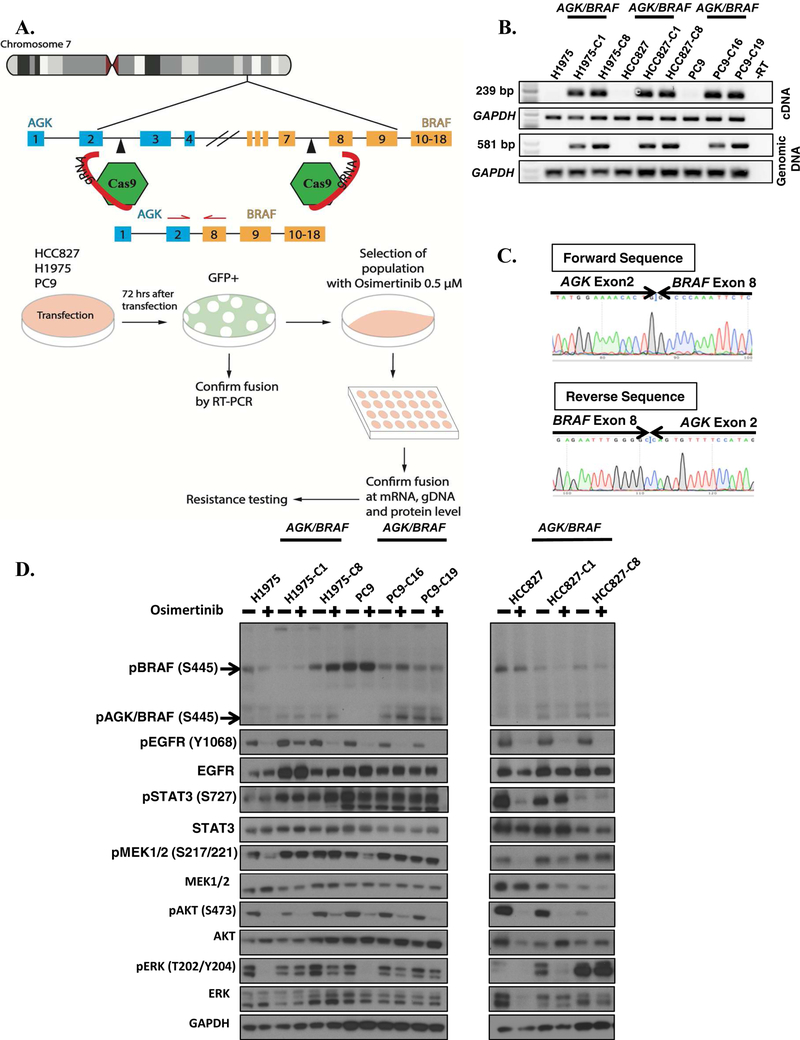
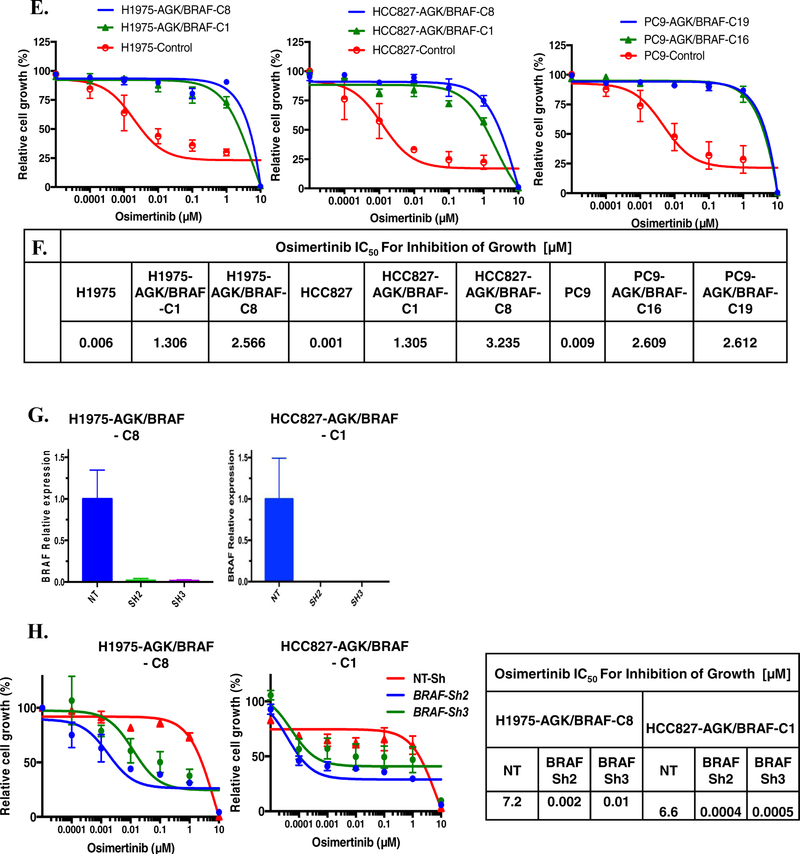
FIGURE 2. Generation and characterization of CRISPR/Cas9 AGK/BRAF cell lines.
A. CRISPR/Cas9 genome engineering protocol scheme. B. Expression of AGK/BRAF. C. Sanger sequencing of PCR product confirming fusion in cell line of AGK exon 2 with exon 8 of BRAF. D. H1975 and PC9 cells expressing AGK/BRAF were treated with 0.5 osimertinib for 1 h, whole-cell extracts prepared and then lysates were subjected to immunoblotting. Results represent 3 independent experiments. E. The indicated cell lines were plated at a density 7,500/well in 96-well plates, treated with osimertinib for 96 h and the IC50 values for growth inhibition are shown in the Table in panel F. G-H. Cells were plated at a density of 150,000 cells/well in 6-well plates then infected 24 h later with lentiviruses harboring the indicated shRNAs and then selected with puromycin 48 h later. BRAF mRNA levels was determined by qRT-PCR (G) or cells were replated in osimertinib and growth assessed 96 later (H). IC50 values for growth inhibition were determined by nonlinear regression analysis using Graphpad Prism software. Results represent the mean ± SD of 2 experiments.


