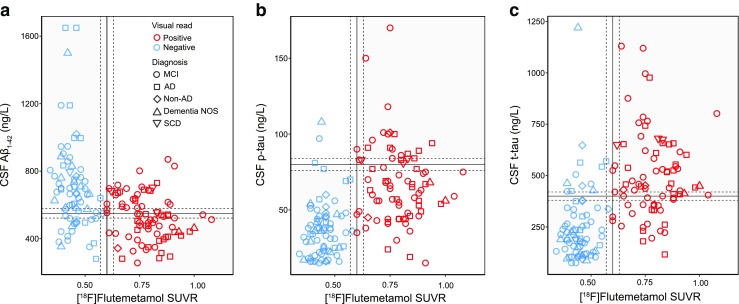
Fig. 2.

Relationships between CSF biomarkers and isocortical composite [18F]flutemetamol SUVR. The vertical lines mark the cut-off value of 0.60 for isocortical composite [18F]flutemetamol SUVR; the horizontal linesmark the cut-off values for Aβ1-42 (a <550 pg/mL), p-tau (b >80 pg/mL) and t-tau (c >400 pg/mL); the dashed lines indicate borderline zones (within 5% of the cut-off values); and the grey and white quadrants indicate concordance and discordance between biomarkers, respectively
