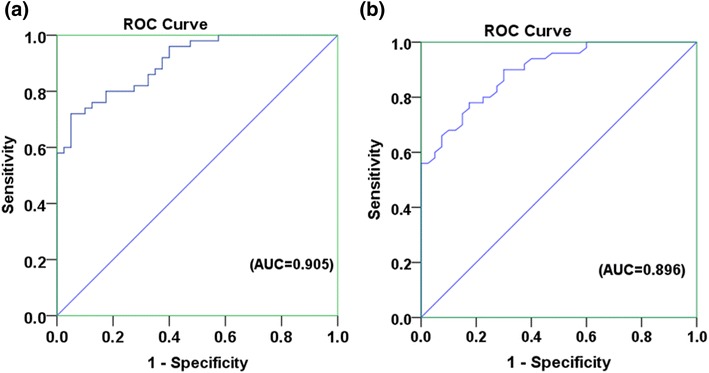
Fig. 2.

ROC curve analysis. a miR-183-5p can distinguish PCa patients from controls [(AUC = 0.905), (95% CI 0.847–0.96) (P value < 0.001)]. b The expression change of miR-183-5p can distinguish PCa patients from BPH patients [(AUC = 0.896) (95% CI 0.834–0.957) (P value < 0.001)]. ROC receiver operating characteristic, AUC area under the curve, CI confidence interval
