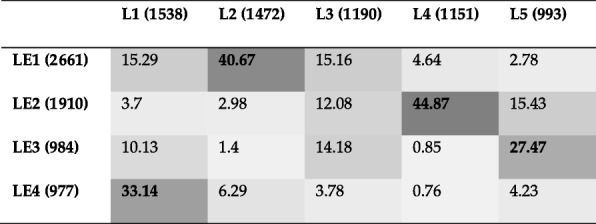
Table 4.
Jaccard index (as a percentage) between the communities identified by two dissimilar methods, namely, Louvain and Leading Eigen for the Yeast PPI network. (L1 to L5: communities detected by Louvain; LE1 to LE4: communities detected by Leading Eigen). The numbers in parenthesis represent the number of genes in each community. Community pairs with maximum overlap (e.g., L1 vs. LE4) are indicated in bold text

