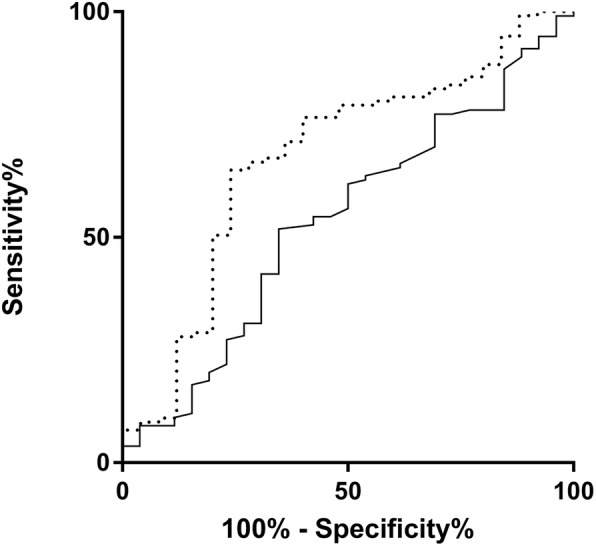
Fig. 3.

ROC analyses. Influence of mean attenuation (MA) and diameter of the pancreatic duct (DPD) on severe postoperative pancreatic fistula (POPF, grade B and C following the ISGPF classification). Dotted line indicates MA, continuous line indicates DPD. In the analysis of the Receiver operator characteristics (ROC) curve, the area under the curve (AUC) were 0.716 and 0.723 in regards to severe POPF, respectively
