Fig. 3.
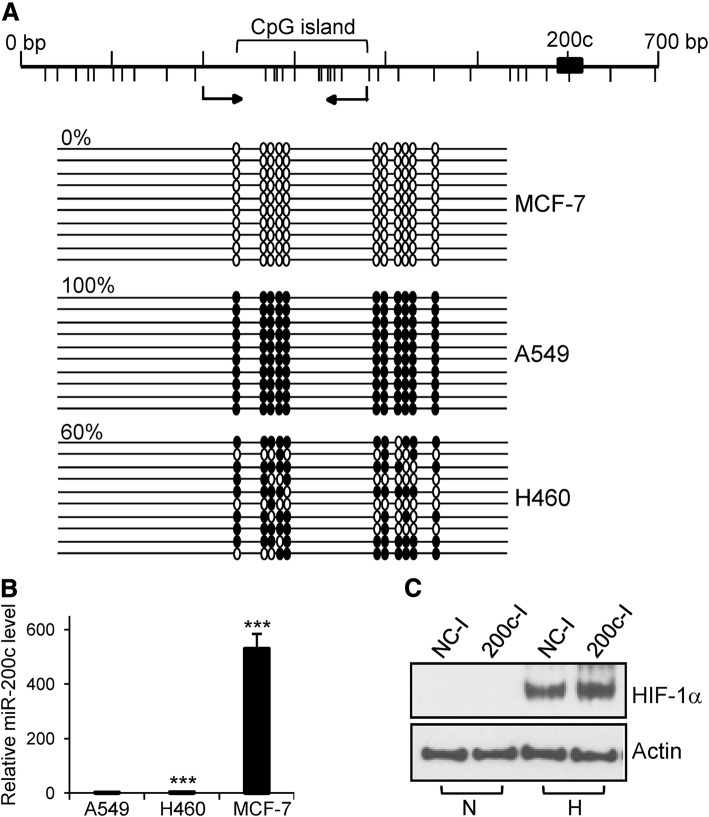
DNA methylation and the expression of miR-200c. a – The DNA methylation pattern of a CpG island located upstream of miR-200c was examined using bisulfite sequencing. CpG dinucleotides are depicted using vertical bars below the map. The DNA region analyzed via bisulfite sequencing is indicated by the arrows below the map. The methylated and non-methylated CpG sites are indicated by filled and open circles, respectively. Each line represents an independent clone. Percentages indicate the level of DNA methylation. b – The expression of miR-200c was assessed via quantitative RT-PCR. The expression level of miR-200c in A549 cells was set at 1. ***p < 0.001. c – Upregulation of HIF-1α protein after transfection with a miR-200c inhibitor. MCF-7 cells were transfected with NC inhibitor or miR-200c inhibitor. The following day, the transfected cells were incubated in normoxia and hypoxia. After 24 h, total proteins were isolated and subjected to western blot analysis. N; normoxia, H; hypoxia, NC-I; NC inhibitor, 200c-I; miR-200c inhibitor

