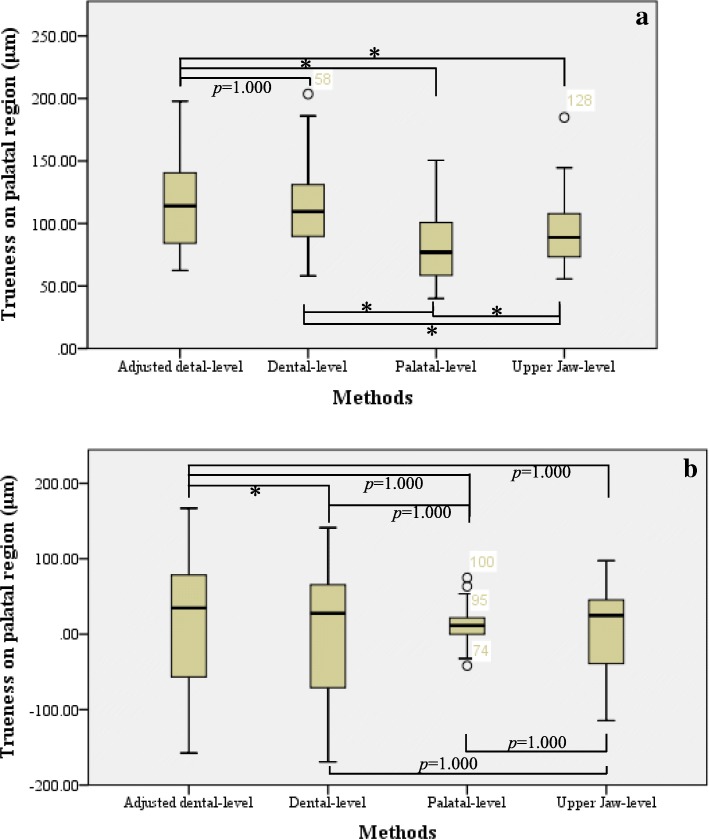
Fig. 4.
Comparison of trueness in palatal region in Group Tr1 between different superimposition methods. a. Absolute deviations of trueness in palatal region: in tests of within-subject effects, F (1.383, 47.009) =41.986, p < 0.0005, η2 = 0.553. b. Signed deviations of trueness in palatal region: in tests of within-subject effects, F (1.162, 39.506) =0.730, p = 0.418, η2 = 0.021. Note: Information shown in the boxplot are median, quartiles, minimum and maximum; the circle represents the outlier; asterisk (*) indicates statistical significance (p < 0.05)

